

Ethereum recently experienced a sharp sell-off after cracking its 1 year high of $444. After selling off to $380 levels, Ethereum price recently signaled a reversal that could be signaling another bullish push. What price levels should be on watch in the near term?
Ethereum Price
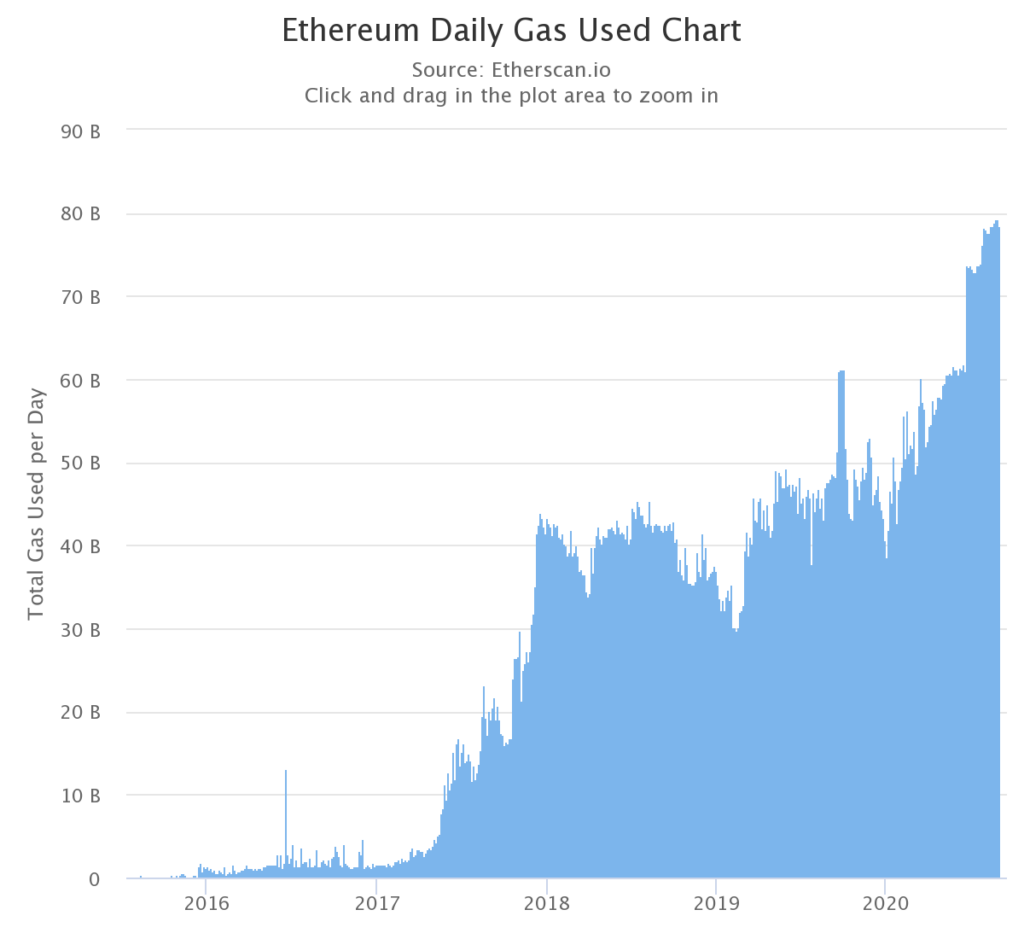
Over the last few months, bulls have been in full control which ultimately lead to Ethereum price hitting yearly highs of $444. Following this push, ETH saw a sharp sell-off that sent the price to $380 levels. One can argue that the biggest road block for Ethereum right now is network congestion. In an environment where DeFi is booming, the ETH blockchain is doing everything in its power to stay afloat. Consequently, Ethereum gas hit an all time high last week, due to transaction output and smart contract deployment on the network.
Ethereum Could Receive Help
Visionary Financial recently reported that OMG Token had seen significant growth this year, fueled by the fact that Tether announced they would be running transactions through OMG Network. This could be bullish for Ethereum in the near term since it could essentially free up congestion on their network. Despite not having a concrete number, it is best believed that the move by Tether could free up 10-15% of Ethereum congestion.
#Crypto weekly performance
Markets cool down but #OMG ( #omgnetwork ) skyrockets with a catalyst being #Tether announcing to use their network for faster transactions.
OMG "proposes" a better solution – reducing #ETH gas fees & congestion upon #DeFi / #Stablecoin boom pic.twitter.com/19w43zTfGR
— Visionary Financial (@VisionaryFinanc) August 22, 2020
Ethereum Technical Analysis
Following the sell-off from yearly highs, there seemed to be positive momentum forming after the bounce off $380 levels. ETH price most recently bounced off $380 levels and rallied back to $400. At the time of this reporting, Ethereum is currently trading at $401.75.
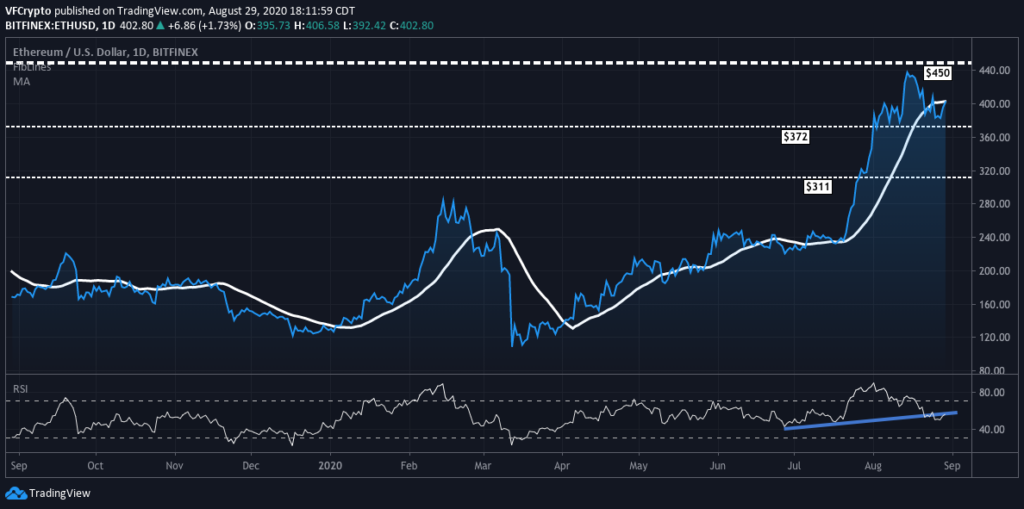
Ethereum currently has strong support right around $372. With this being said, it was bullish to see ETH rally off $380 levels opposed to selling off below $372. As long as ETH can hold the support at $372, it could very well be forming momentum to retest yearly highs around $440-450. At this time, the recent sell-off looks natural as RSI was due to cool down. During the push to yearly highs, RSI ( relative strength index ) hit overbought territories which was a bearish indicator. The recent sell-off gave Ethereum the opportunity to normalize RSI, and put it in a prime spot for another bullish push. As outlined in the chart above, ETH also creeped back above the 25 day moving average which is a positive sign given the circumstances. Historically speaking, ETH has witnesses large price moves when either accepting or rejecting the 25 day moving average.
Cryptocurrency Prices The Last 24HR
- Bitcoin: -0.08%
- Ethereum: +1.76%
- XRP: +1.30%
- Chainlink: +10%
- Litecoin +0.34%
Image Source: Pixabay
Notice: Information contained herein is not and should not be construed as an offer, solicitation, or recommendation to buy or sell securities. The information has been obtained from sources we believe to be reliable; however no guarantee is made or implied with respect to its accuracy, timeliness, or completeness. Authors may own the crypto currency they discuss. The information and content are subject to change without notice. Visionary Financial and its affiliates do not provide investment, tax, legal or accounting advice. This material has been prepared for informational purposes only and is the opinion of the author, and is not intended to provide, and should not be relied on for, investment, tax, legal, accounting advice. You should consult your own investment, tax, legal and accounting advisors before engaging in any transaction. All content published by Visionary Financial is not an endorsement whatsoever. Visionary Financial was not compensated to submit this article Please also visit our Privacy policy; disclaimer; and terms and conditions page for further information.