

Bitcoin price has rallied +60% year to date, as it continues to be one of the best performing asset classes. As mentioned in a previous report, the surge in BTC during a global pandemic has the worlds largest cryptocurrency passing one of the biggest tests yet. With Bitcoin trading around $11.5k , we take a look at some of the most important fundamentals to assess the current valuation.
Bitcoin Market Value To Realized Value
The market value to realized value ( MVRV ratio ) has been one of the most important metrics to help us assess undervaluation vs overvaluation. In order to assess this ratio, we simply take Bitcoins market value and divide it by Bitcoins realized value.
Bitcoins market value and realized value are similar, but also have significant differences. Market value simply takes the current price of Bitcoin and multiplies it by the outstanding circulation. Realized value is arguably more accurate since the metric adjust for “lost bitcoin” and “Hodling” in the marketplace. Realized value is ultimately the aggregated market price of all Bitcoin UTXO’s when they were last moved.
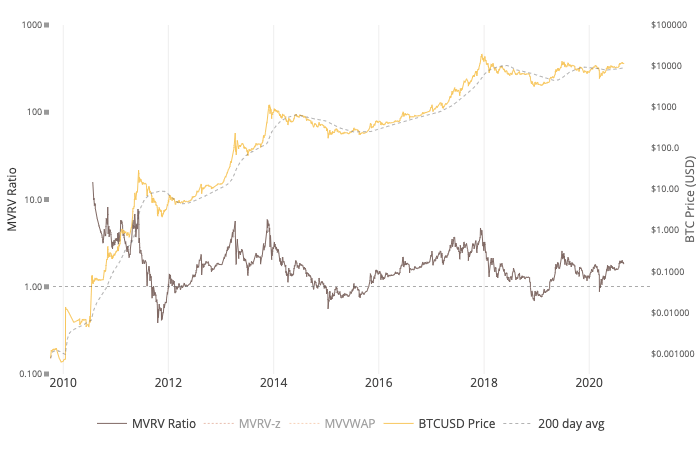
As mentioned above, MVRV ratio is calculated by dividing Bitcoin market value and realized value. Historically speaking, a ratio of 3.7 means Bitcoin is considered overvalued, and a ratio of 1.0 means Bitcoin can be undervalued. At the time of this report, Bitcoins MVRV ratio is sitting at 1.86. If we just look at MVRV ratio, Bitcoin is still significantly undervalued and is in a prime spot for another bull run.
Bitcoin MVRV Z-Score
MVRV Z-score looks at Bitcoins valuation compared to its fair value. A MVRV Z-score below 0.1 represents a market value that is well below realized value, which ultimately signals a good long term buying opportunity. On the flip side, a MVRV Z-score above 7.5 tends to represent an environment where Bitcoins market value is above its realized value which can signal a market top.
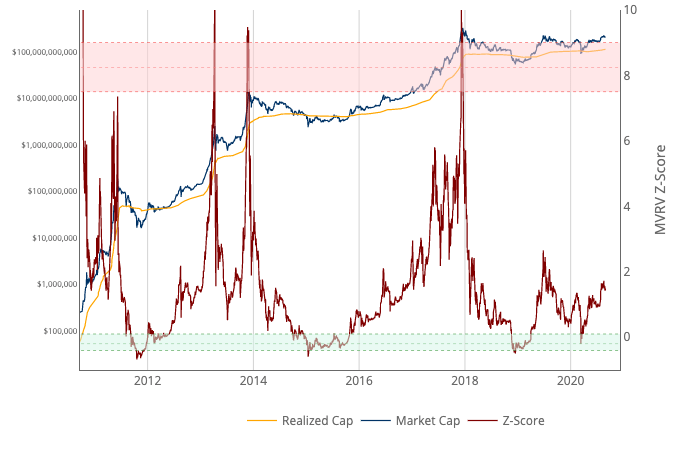
At the time of this reporting, Bitcoins MVRV Z-score sits right around 1.47 which is bullish based on price action since inception.
Bitcoin Mayer Multiple
Mayer multiple has been one of the most important tools to gauge the current price of Bitcoin compared to its long range price action ( 200 day moving average ). We can further identify if Bitcoins price is overbought or oversold within the context of long time frames. Calculating the Bitcoin Mayer Multiple is fairly easy, taking Bitcoins price and dividing it by the 200 day moving average.
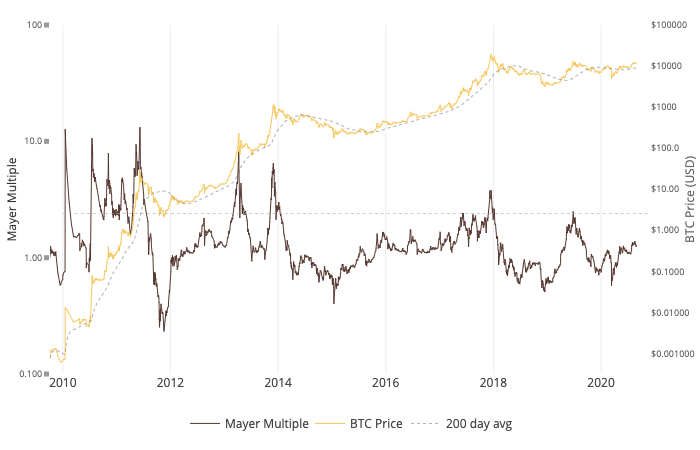
Based on price action since inception, a Bitcoin Mayer Multiple of 1.00 has been the initial trigger to bull markets. On the contrary, a Mayer Multiple above 2.4 has signaled the initiation of speculative bubbles.
At the time of this reporting, Bitcoins Mayer Multiple is 1.27 , which is again another bullish longterm indicator.
2 Year Moving Average Multiplier
Another great indicator of long term sentiment comes from the 2 year moving average multiplier. This metric shows when Bitcoin is overvalued or undervalued in the long term. On the chart below, the red line displays the “2 year MA x 5”. Historically speaking, when Bitcoin is above this threshold, it has signified a market top.
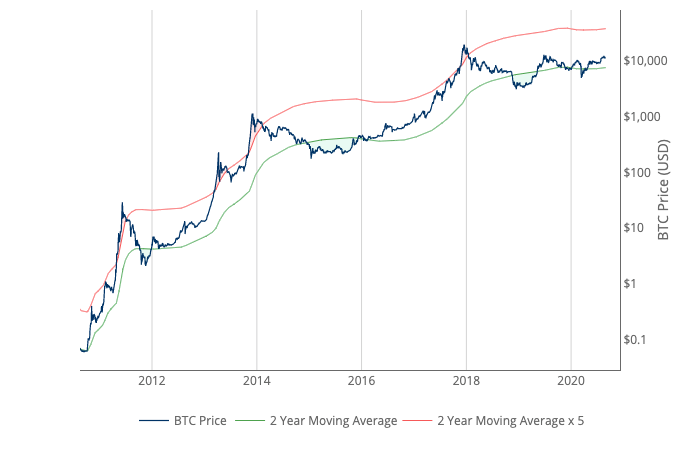
During the last bull run to all-time highs, it is important to note that this indicator nailed it. Once Bitcoins price hit the 2 year moving average x 5 threshold, it was at its all-time high around $20,000. It then sold off due to Bitcoin reaching the impeding market top. Based on this metric, Bitcoin is nowhere near its market top, which builds a stronger argument for bullish sentiment.
Summary
When taking a look at some of the strongest valuation metrics, it becomes extremely hard to argue the bearish case. Bitcoin market value to realized value, MVRV Z-score, Mayer Multiple, and the 2 year moving average multiplier are all screaming a bullish push. In addition, with scares mounting around the US Dollar, Bitcoin is in a perfect position to enter a strong rally and even potentially test all-time highs quicker than many believe.
Image Source: Unsplash
Notice: Information contained herein is not and should not be construed as an offer, solicitation, or recommendation to buy or sell securities. The information has been obtained from sources we believe to be reliable; however no guarantee is made or implied with respect to its accuracy, timeliness, or completeness. Authors may own the crypto currency they discuss. The information and content are subject to change without notice. Visionary Financial and its affiliates do not provide investment, tax, legal or accounting advice. This material has been prepared for informational purposes only and is the opinion of the author, and is not intended to provide, and should not be relied on for, investment, tax, legal, accounting advice. You should consult your own investment, tax, legal and accounting advisors before engaging in any transaction. All content published by Visionary Financial is not an endorsement whatsoever. Visionary Financial was not compensated to submit this article Please also visit our Privacy policy; disclaimer; and terms and conditions page for further information.