

We take a look at Bitcoin price, Ethereum price, and XRP price for the week of January 8, 2021. Aside from fundamentals, we rely heavily on technical analysis to assess overall sentiment. This is achieved by identifying key support and resistance levels that traders and investors will be watching in the short term.
Bitcoin Price
At the time of this report, the Bitcoin price is currently sitting at $40,533. BTC continued its parabolic move over the last week, surging ~ 26%. After creating new all-time highs in 2020, the largest digital asset by market cap is showing no signs of slowing down. Bitcoin has rallied ~ 122% in the last 30 days and billionaire, Chamath Palihapitiya, recently stated that Bitcoin price could surge to $200,000 in the foreseeable future as investors continue to seek uncorrelated hedge assets. Over the last year, BTC has now experienced ~ 417% growth.
Bitcoin Technical Analysis
In our most recent market analysis for the week of January 1, 2021, it was mentioned that $28,400 would be an important support zone. It was believed that Bitcoin could experience a strong pullback if that level was rejected. As we will quickly see from the chart below, BTC never rejected this support level and continued strong upward momentum.
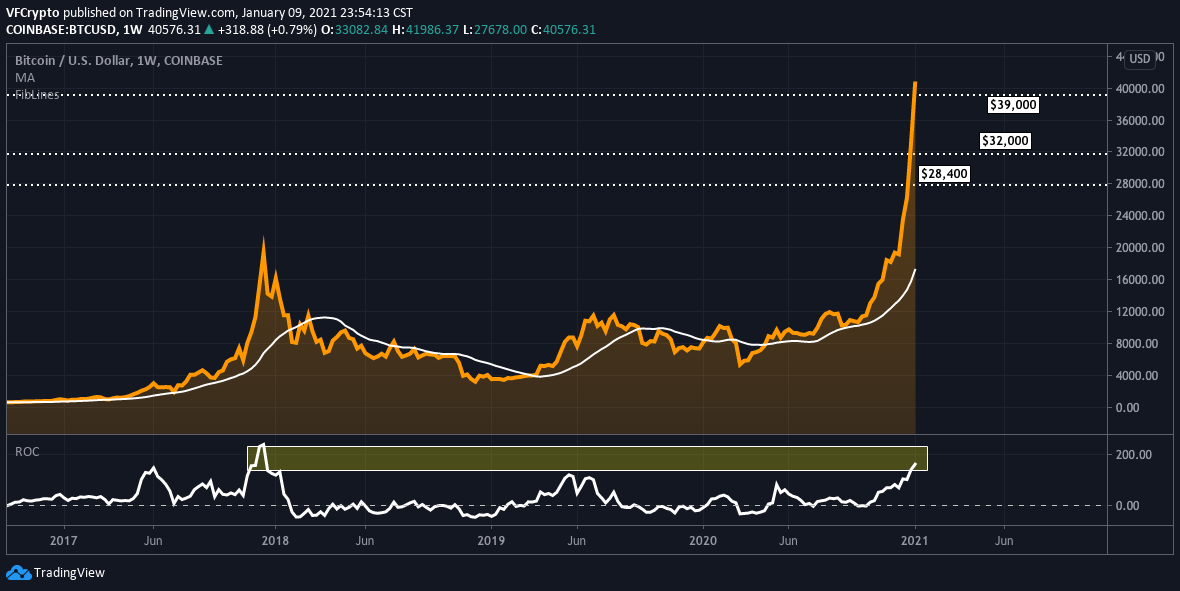
The new support level that traders have their eye on is $39,000. A rejection could trigger a strong pullback. With last week’s added rally, BTC momentum is peaking. We come to that conclusion by assessing the ROC ( rate of change ) indicator. If we look at ROC at the bottom of the chart, the level of positive momentum is mirroring 2017 levels. BTC hit these levels right before its massive sell-off at the beginning of 2018. With this type of setup formulating, support levels will be crucial moving forward. On the contrary, if BTC stays above $39,000, any short-term sell-offs could be a bear trap.
Ethereum Price
At the time of this report, the Ethereum price is currently hovering around $1,316. Among large-cap altcoins, ETH was an outlier last week. Over the last 7 days, ETH has surged ~ 69%. Despite Bitcoin seeing ~ 417% growth over the last year, ETH has doubled that, seeing ~ 854% growth. Per our recent ETH analysis, the rally last week was justified for both fundamental and technical reasons.
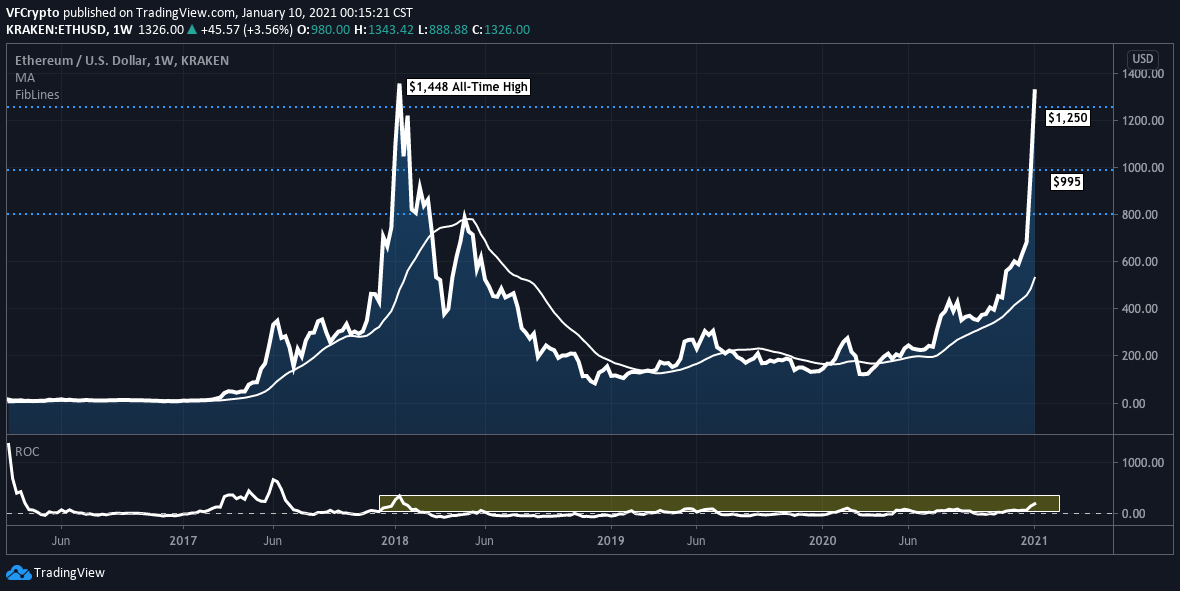
It was previously mentioned that ETH conviction was high, especially since the digital asset was trading at a significant discount from its all-time high. With the ~ 69% rally last week, Ethereum has inched closer to retesting all-time highs. As we can see from the chart above, ETH is nearing $1,448 levels. With BTC already doubling its 2018 all-time highs, investors argue that ETH is trailing behind, and could have significantly more upside in the short-term. Despite this theory, we will continue to monitor strong support levels to keep risk in check. It appears that $1,250 is a support level that many traders/investors have on their radar.
As long as ETH stays above $1,250 in the short-term, the digital asset is expected to re-test all-time highs and put in new highs. On the flip side, if ETH witnesses a pull-back below $1,250, watch out for a sharp sell-off.
XRP Price
At the time of this report, XRP is currently trading at $0.35728. The fourth-largest digital asset by market cap rallied ~ 61% over the last week. After closing out 2020 with the SEC lawsuit against Ripple, investors are trying to build conviction after the digital asset saw a sharp ~ 60% decline. Ripple leadership continued to inform the public last week that they do not believe the SEC will prevail based on XRP’s infrastructure. Investors are deploying more risk capital despite many unknowns.
XRP is also benefitting from overall bullish sentiment in the crypto space right now. Pending a positive outcome from the Ripple lawsuit, XRP arguably has some of the largest potential upside in the market. Despite some critics warning that XRP price could become worthless following the SEC lawsuit, other analysts believe that Ripple will prevail and XRP will have the last laugh.
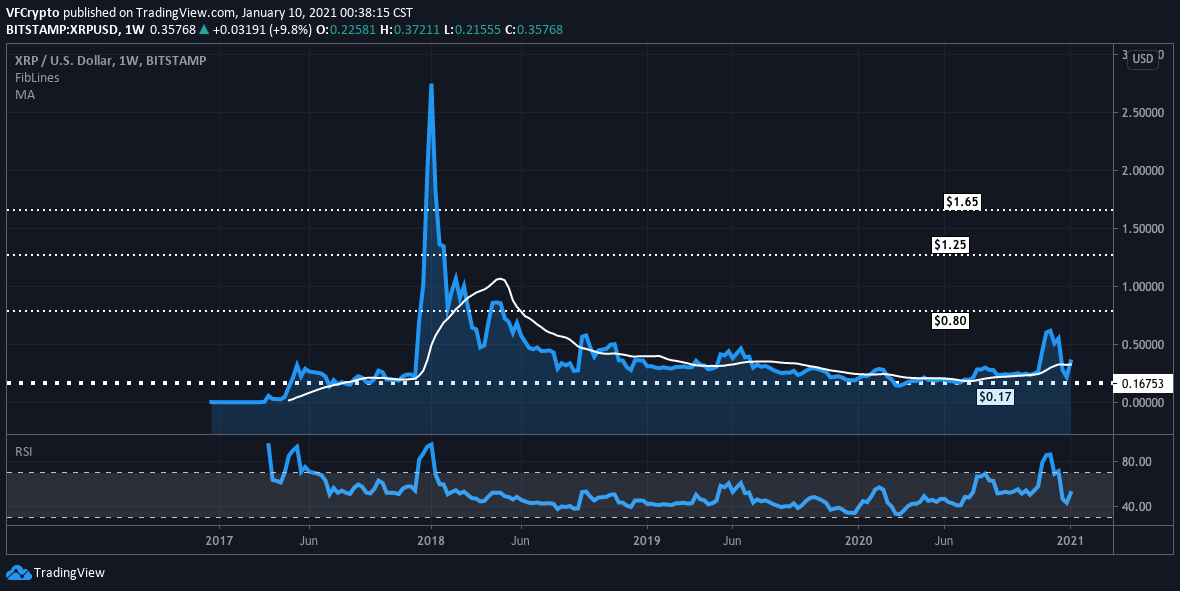
Following XRP’s strong bounce off important $0.17 support levels, it has continued to build positive momentum. In previous XRP analysis, it was believed that investors were taking their chances with the SEC and deploying risk capital following the ~ 60% sell-off. Despite many domestic exchanges offering less support for XRP pending regulatory clarity, nothing has really changed internationally, where XRP performs 90% + of its output. To manage risk, many investors will keep an eye on $0.17 levels. As long as XRP hovers above, watch for a parabolic move that could test $0.80 resistance in the short-term. If this happens, there will be a lot of FOMO rushing into XRP that could push it to $1.25 levels.
On the contrary, if XRP rejects $0.17 support levels, this would be a strong sell-signal based on historical price action.
Notice: Information contained herein is not and should not be construed as an offer, solicitation, or recommendation to buy or sell securities. The information has been obtained from sources we believe to be reliable; however no guarantee is made or implied with respect to its accuracy, timeliness, or completeness. Authors may own the crypto currency they discuss. The information and content are subject to change without notice. Visionary Financial and its affiliates do not provide investment, tax, legal or accounting advice.
This material has been prepared for informational purposes only and is the opinion of the author, and is not intended to provide, and should not be relied on for, investment, tax, legal, accounting advice. You should consult your own investment, tax, legal and accounting advisors before engaging in any transaction. All content published by Visionary Financial is not an endorsement whatsoever. Visionary Financial was not compensated to submit this article Please also visit our Privacy policy; disclaimer; and terms and conditions page for further information.