
XRP Price has been relatively quiet the last week, rising about +1.6%. Based on previous technical analysis, it was believed that XRP price could experience +32% upside from current levels based on historical price action. With XRP consolidating the last week, what will traders be watching for this week?
XRP Price
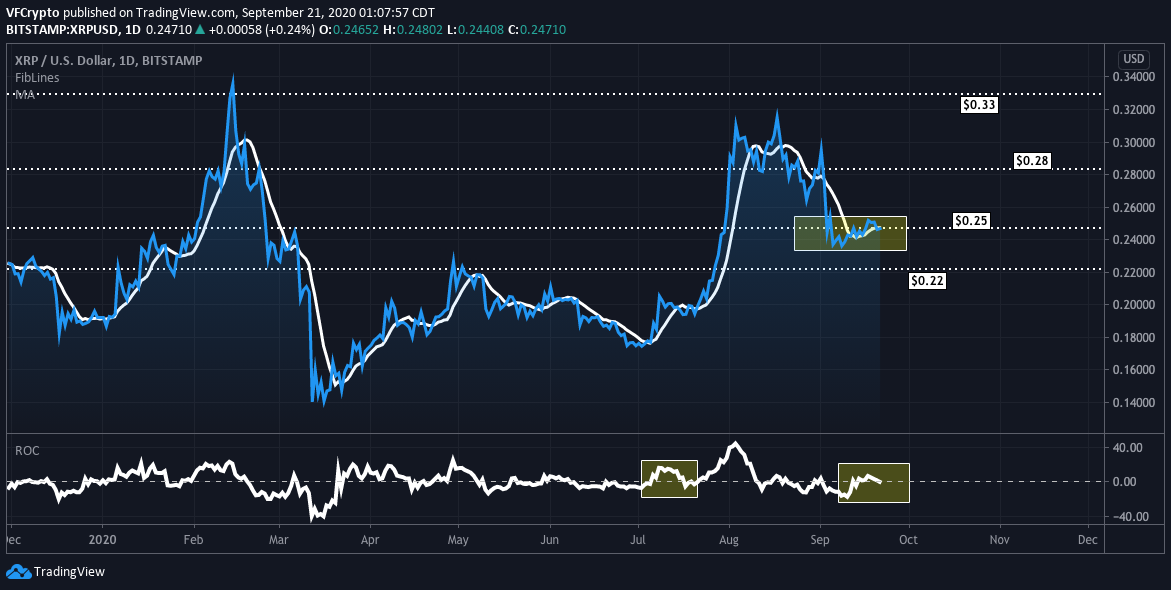
At the time of this report, XRP price is currently hovering around $0.24612. Over the last week, the 4th largest digital asset by market cap has grown about +1.6%, which is underperforming Bitcoins +6% output. Compared to other large cap cryptocurrencies, here is how XRP price performance stacks up the last 7 days.
- XRP: -1.6%
- Bitcoin: +6.1%
- Ethereum: +1.9%
- Binance Coin: -12%
- Chainlink: -18.70%
- Cardano: -6%
- EOS: -1.89%
XRP Technical Analysis Update
Back on September 14th, Visionary Financial shared XRP technical analysis that projected XRP price rallying +32% in the near term. Based on price action the last 7 days, it seems as if the technicals are getting even stronger. Despite the rally not being “confirmed yet,” XRP is flirting with key resistance levels that traders will be watching closely this week.
In previous analysis, XRP was attempting to test $0.25 resistance which has historically been an important level. It was the same resistance level that fueled the strong rally in February of this year. Over the last week, XRP price briefly accepted $0.25 resistance but quickly dipped back below. Price action has been fairly constant, as XRP continued to consolidate for the most part.
XRP Price Levels
XRP continues to flirt with $0.25, attempting to close above the strong resistance level. Over the last week, many large cap altcoins have witnessed heavy sell-offs, but XRP appears to be holding up well at current levels, potentially getting ready for the next leg up. As mentioned before, if XRP can power its way through $0.25 in the short term, it could very well retest yearly highs around $0.33. In late July of this year, XRP price had a similar setup in which it built up a solid consolidation phase before ultimately powering its way up.
XRP Momentum
In terms of overall momentum, there are a few key indicators we leverage to assess the current environment. One of the most important ones is the Rate of Change indicator which is applied at the bottom of the chart above. The higher this reading is, the stronger the momentum is. We can see that XRP rate of change has a very similar setup that formed prior to the rally in late July.
If you follow rate of change on the chart above, it has historically been highly correlated to price action. In addition, RSI is in favorable levels, and MACD is experiencing a bullish crossover. Some of the top momentum indicators are foreshadowing bullish price action in the near term.
Notice: Information contained herein is not and should not be construed as an offer, solicitation, or recommendation to buy or sell securities. The information has been obtained from sources we believe to be reliable; however no guarantee is made or implied with respect to its accuracy, timeliness, or completeness. Authors may own the crypto currency they discuss. The information and content are subject to change without notice. Visionary Financial and its affiliates do not provide investment, tax, legal or accounting advice. This material has been prepared for informational purposes only and is the opinion of the author, and is not intended to provide, and should not be relied on for, investment, tax, legal, accounting advice. You should consult your own investment, tax, legal and accounting advisors before engaging in any transaction. All content published by Visionary Financial is not an endorsement whatsoever. Visionary Financial was not compensated to submit this article Please also visit our Privacy policy; disclaimer; and terms and conditions page for further information.