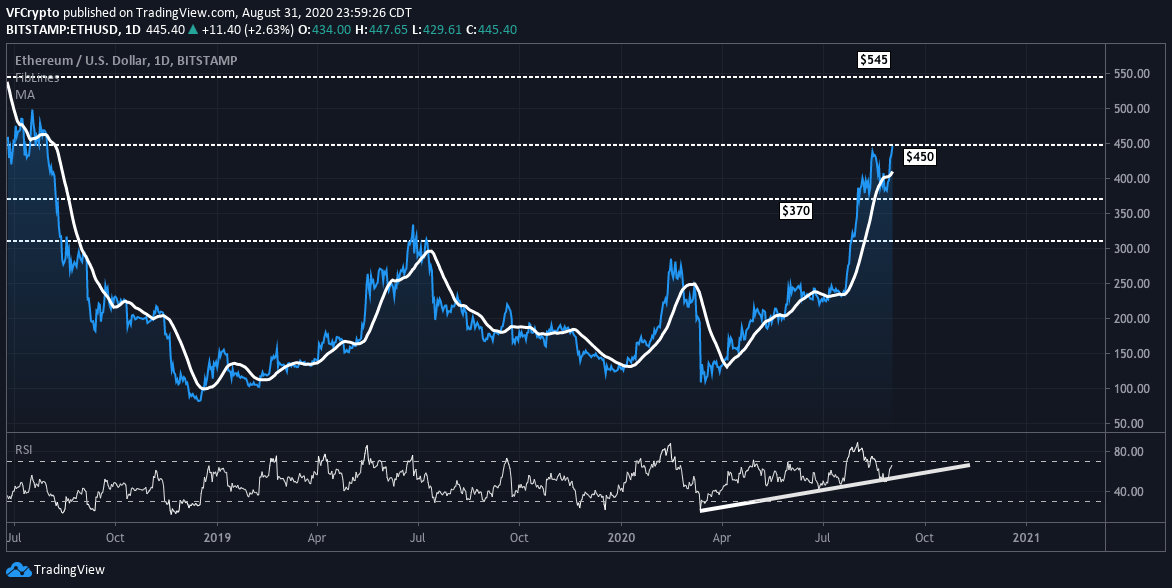
ETH price is maintaining its bullish momentum as it continues to flirt with its 52 week high. As outlined in previous analysis, ETH was signaling a strong bull move after creeping back above $400 a few days back. As we approach the 52 week high, where could ETH be heading in the near term?
Ethereum Analysis
Over the last 24hr, ETH price has rallied +4.6% as it continues to outperform Bitcoin, XRP, and other top 10 digital assets by market capitalization. The recent surge comes at no surprise as the technicals have looked extremely bullish for the last few days. In a previous report by Visionary Financial, Ethereum was flashing bullish signals ever since surpassing $400 levels after the steep sell-off from yearly highs. At the time of this report, Ethereum is currently trading at $445. If we take a look at ETH on the one year time frame, we will quickly see that $445.99 is the 52 week high. Ethereum technicals continue to be impressive, signaling an environment where ETH could put in higher highs.
#ETH analysis yesterday was spot on, as we have seen a +7% rally the past 24HR. If you didn't yet, check out the report from yesterday to see where it might be heading. $ETH https://t.co/tmb1iWaPEr
— Visionary Financial (@VisionaryFinanc) August 31, 2020
Ethereum Technical Analysis
On August 20th, ETH cracked its yearly high right around $445. Following this surge, the price took a drastic drop, selling-off all the way down to $380 levels. As Visionary Financial previously outlined, it was bullish that ETH did not reject $372 during the previous sell-off. The quick recovery to $400 levels was a bullish indicator, and it was believed that ETH would retest the yearly highs.
If we fast forward to the last 24 hours, Ethereum followed the analysis to a tee. The previous sell-off was natural as it gave the digital asset the opportunity to “cool-down.” If we take a look at RSI right now, it is in a perfect position for another leg up. If Ethereum can power its way through the yearly high of $445.99, it appears that the digital asset will be eyeing $545 resistance levels. In order to manage risk, traders will be watching the 25 day moving average and the $450 resistance level. If ETH price fails to accept $450 like it did on August 20th, you could very well see another strong sell-off. In addition, it will also be important for ETH to hold above that 25 day moving average ( white line on the chart above ). Doing so should help it propel its way up. The fact that ETH is retesting the yearly high is a bullish sign that should not be ignored.
Image Source: Unsplash
Notice: Information contained herein is not and should not be construed as an offer, solicitation, or recommendation to buy or sell securities. The information has been obtained from sources we believe to be reliable; however no guarantee is made or implied with respect to its accuracy, timeliness, or completeness. Authors may own the crypto currency they discuss. The information and content are subject to change without notice. Visionary Financial and its affiliates do not provide investment, tax, legal or accounting advice. This material has been prepared for informational purposes only and is the opinion of the author, and is not intended to provide, and should not be relied on for, investment, tax, legal, accounting advice. You should consult your own investment, tax, legal and accounting advisors before engaging in any transaction. All content published by Visionary Financial is not an endorsement whatsoever. Visionary Financial was not compensated to submit this article Please also visit our Privacy policy; disclaimer; and terms and conditions page for further information.


