We take a look at Bitcoin price, Ethereum price, and XRP price for the week of April 25, 2021. Aside from fundamentals, we rely heavily on technical analysis to assess overall sentiment. This is achieved by identifying key support and resistance levels that traders and investors will be watching in the short term. Based on the current price action, what should you watch for next week?
Bitcoin Price
At the time of this report, Bitcoin price is currently hovering around $49,891. Over the last week, the largest digital asset by market cap has seen a sharp sell-off (~ 17.2%). This was the second week in a row that bears had control of Bitcoins price. During the last two weeks, BTC has retraced (~ 16.8%). Contrary to this price action, BTC has still seen (~ 52%) growth over the last 3 months.
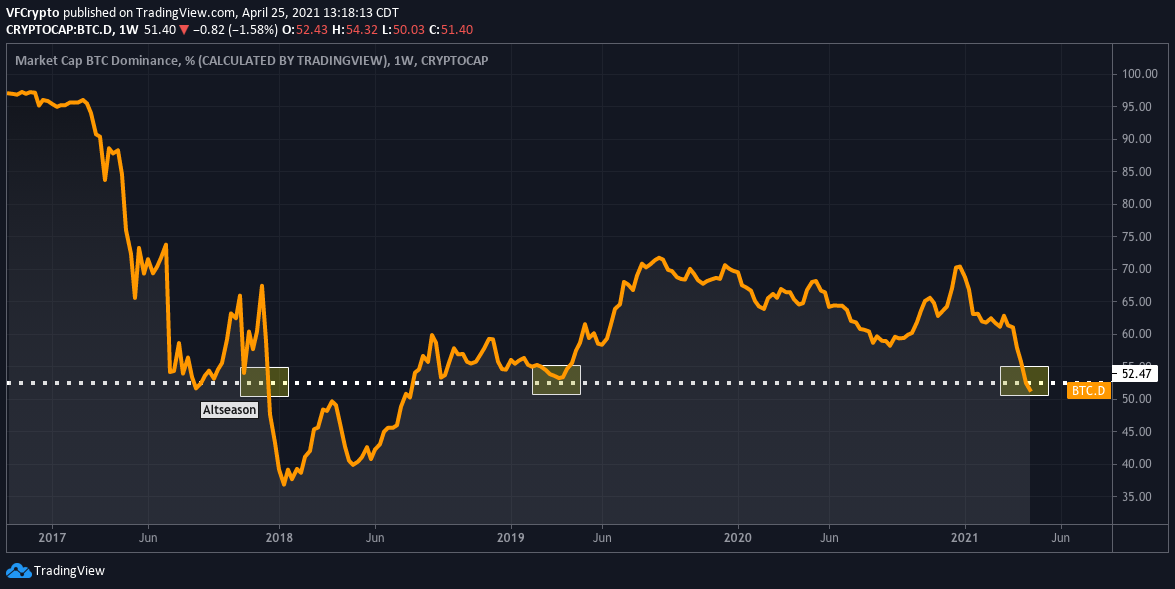
Investors and traders continue to watch Bitcoin’s market dominance, which has continued to trend down since late 2019. Most recently, BTC is struggling to maintain 51% dominance. This level has only been tested a couple of times since 2017. When BTC rejected 51% dominance in Dec 2017, this event fueled altseason. We saw a similar trend in March 2019, but BTC was able to maintain support and build significant momentum to the upside. The recent rejection looks very similar to the 2017 price action.
Bitcoin Technical Analysis
Based on the current price action, we are looking at $44,000 support and $53,200 resistance. With momentum still signaling bearish, BTC could very well test $44,000 support in the short term. This makes more sense when looking at Bitcoin’s market dominance right now ( explained above ). Sentiment will switch hands if BTC can accept $53,200 resistance. We will remain bearish until it does so.
Ethereum Price
At the time of this report, Ethereum is currently trading at $2,295. ETH has outperformed BTC the last week, witnessing (~7.2%) growth. ETH has also seen a wider margin in BTC outperformance over the last month with its (~44.7%) growth. Bullish sentiment has poured into ETH recently, especially with miners raising gas limits to about 15 million for the first time. Investors believe this initiative will reduce congestion and better serve on-chain activities.
Ethereum Technical Analysis
Based on the current price action, we are watching $2,141 support and $2,600 resistance. As long as ETH can hold $2,141 support, we believe that Ethereum could test $2,600 resistance in the short term. Indicators such as ROC ( rate of change ) show us an environment where bullish momentum is heating up. A ROC above 0.00 denotes bullish sentiment. Previous rallies have been triggered when Ethereums ROC crossed above 0.00. We will continue to watch this indicator closely. On the flip side, if ETH changes sentiment and decides to reject $2,141 support, we could see a strong sell-off in the short term.
XRP Price
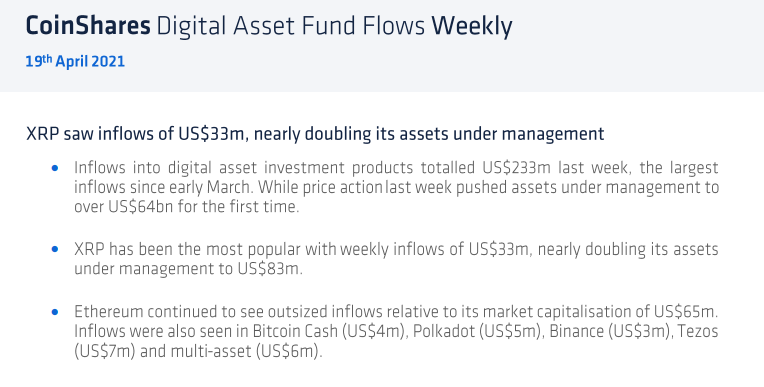
At the time of this report, XRP is currently trading at $1.09. Despite seeing explosive growth over the last month (~113%), XRP has fallen (~29%) over the last week. According to a recent report by Coinshares, institutional investors are allocated large amounts of capital into XRP. For the report dated April 19th, XRP was labeled as the most popular digital asset with $33m weekly inflows.

Despite Ripple still dealing with its SEC lawsuit, large amounts of risk capital continue to pour into XRP. As Visionary Financial previously outlined, investors are watching the positive developments in court over the last month. You are seeing an environment right now where investors are taking a calculated risk on XRP. If Ripple can settle with the SEC, XRP offers some of the largest potential upsides in the market right now. Also, 100+ financial institutions involved in RippleNet are waiting for clarity on XRP. If XRP gets classified as a non-security, you could see all sorts of utility kick in for Rupple and its native digital asset.
XRP Technical Analysis
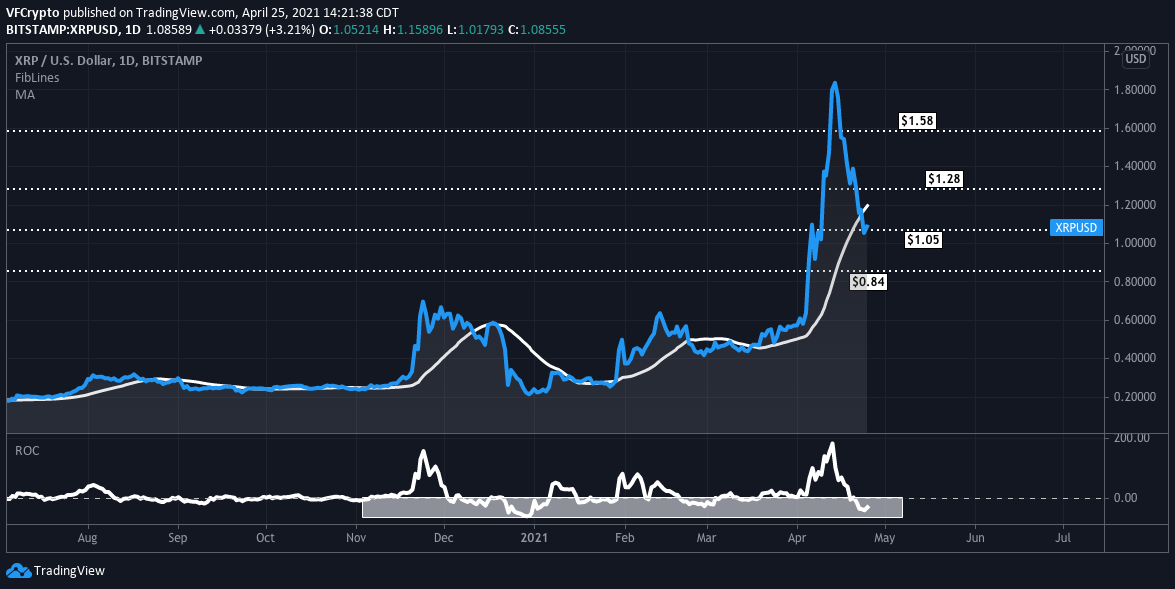
Based on the current price action, we are watching $1.05 support and $1.28 resistance. As long as XRP can hold $1.05 support, we strongly believe XRP will re-test $1.28 resistance in the short term. In the event it does so, we could see $1.58 levels being re-tested. On the contrary, if XRP rejects $1.05 support, it could retrace to $0.84 levels before another leg up.
Similar to Ethereum, we are watching XRP ROC levels ( rate of change ). XRP is getting very close to hovering above 0.00 ROC levels. Bulls seem to be accumulating right now, despite a sell-off the last week. If XRP hovers above 0.00 ROC levels, it will be extremely bullish based on historical price action.
Notice: Information contained herein is not and should not be construed as an offer, solicitation, or recommendation to buy or sell securities. The information has been obtained from sources we believe to be reliable; however, no guarantee is made or implied with respect to its accuracy, timeliness, or completeness. Authors may own the cryptocurrency they discuss. The information and content are subject to change without notice. Visionary Financial and its affiliates do not provide investment, tax, legal, or accounting advice.
This material has been prepared for informational purposes only and is the opinion of the author, and is not intended to provide, and should not be relied on for, investment, tax, legal, accounting advice. You should consult your own investment, tax, legal, and accounting advisors before engaging in any transaction. All content published by Visionary Financial is not an endorsement whatsoever. Visionary Financial was not compensated to submit this article Please also visit our Privacy policy; disclaimer; and terms and conditions page for further information.


