

Over the last week, XRP price has continued bearish price action, falling -14.6%. Based on historical price action, what important support level must XRP hold in the short-term? We take a look at XRP on the one year chart to assess relevant support and resistance levels.
XRP Price
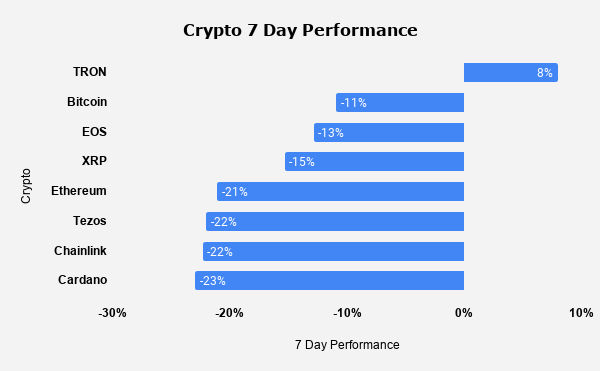
During the last 7 days, XRP price ( XRPUSD ) has followed the overall market sentiment, falling -14.6%. Aside from TRON, most of the top cryptocurrencies by market capitalization have fallen double digits. At the time of this report, XRP is currently trading at $0.24035 – with a market cap of $10,852,288,108. During the last 30 days, XRP is down -18% and during the last 1 year, XRP price is down -7%.
Based on historical price action, what important support level does XRP need to hold in the short-term to avoid a drastic sell-off?
XRP Technical Analysis
Back on August 28th, Visionary Financial shared XRP technical analysis in which we outlined $0.26 being an important support zone. It was believed that XRP price would experience another leg down if price could not hold $0.26 levels.

This theory quickly came to fruition as XRP rejected $0.26 and tested $0.235 levels. You can see the original technical analysis from August 28th above.
More Bearish Price Action Ahead?
With XRP recently failing to hold the $0.26 levels, we will now have our eyes on support at $0.22. If XRP rejects this level, traders will be looking at another leg down. Based on historical price action, this could be a fairly significant level to watch. Based on the chart below, we have outlined the 100 day moving average. This is represented by the white line that has been tracking the 100 day moving average for the last year.
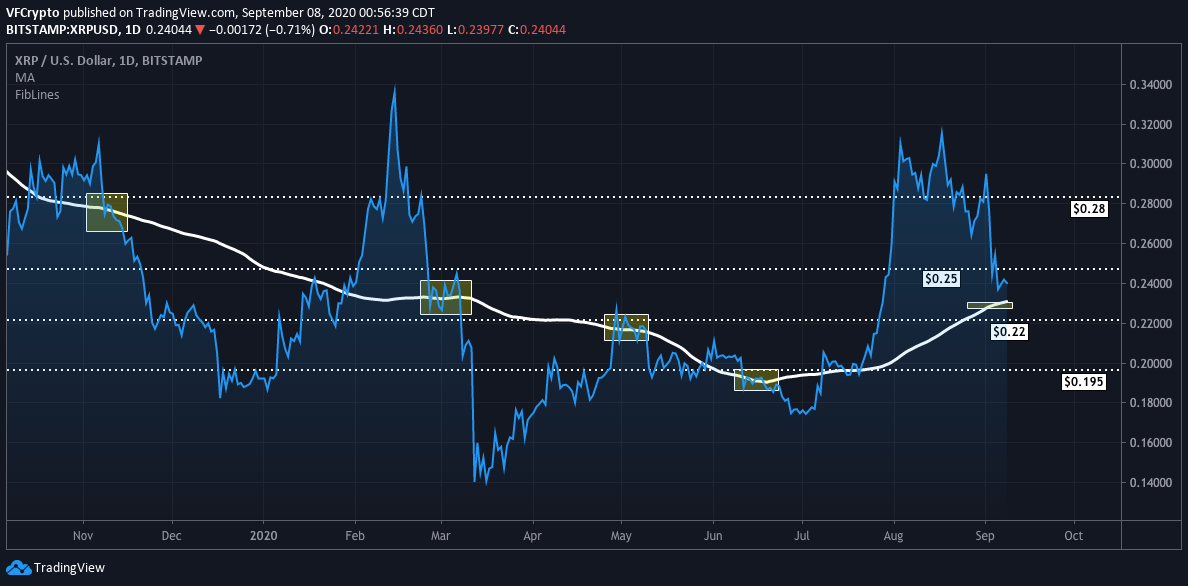
XRP inches closer to dipping below the 100 day MA
With the recent sell-offs, XRP is now inching closer to rejecting the 100 day moving average. Historically speaking, this has resulted in some steep sell-offs. Since November 2019, this has occurred 4 different times. After doing so, XRP has witnessed the following price action:
- November 2019 100 day MA rejection: -36%
- March 2020 100 day MA rejection: -39%
- May 2020 100 day MA rejection: -14%
- June 2020 100 day MA rejection: -11%
XRP Technical Analysis Wrap
Given the circumstances referenced above, it will be very important for XRP to not reject the $0.22 support level. In doing so, we believe that bears would gather more momentum, resulting in another strong leg down. If this were to happen, one could argue that XRP price could test the $0.195 levels to the downside, which would represent -18% sell-offs from the current levels.
Image Source: Unsplash
Notice: Information contained herein is not and should not be construed as an offer, solicitation, or recommendation to buy or sell securities. The information has been obtained from sources we believe to be reliable; however no guarantee is made or implied with respect to its accuracy, timeliness, or completeness. Authors may own the crypto currency they discuss. The information and content are subject to change without notice. Visionary Financial and its affiliates do not provide investment, tax, legal or accounting advice. This material has been prepared for informational purposes only and is the opinion of the author, and is not intended to provide, and should not be relied on for, investment, tax, legal, accounting advice. You should consult your own investment, tax, legal and accounting advisors before engaging in any transaction. All content published by Visionary Financial is not an endorsement whatsoever. Visionary Financial was not compensated to submit this article Please also visit our Privacy policy; disclaimer; and terms and conditions page for further information.