


Across the past week, the cryptocurrency market has once again begun to fall in volume following the previous week’s upward momentum. A majority of the top 20 assets fell by up to 12% in the past week, resulting in a market cap decrease of 200 million, with the total market capitalization realizing $1.08T. This downward price momentum appears to be indicative of the market resuming its recent volatility, which has continually thrown the market into periods of upward price movement followed by sharp declines.
Bitcoin (BTC)
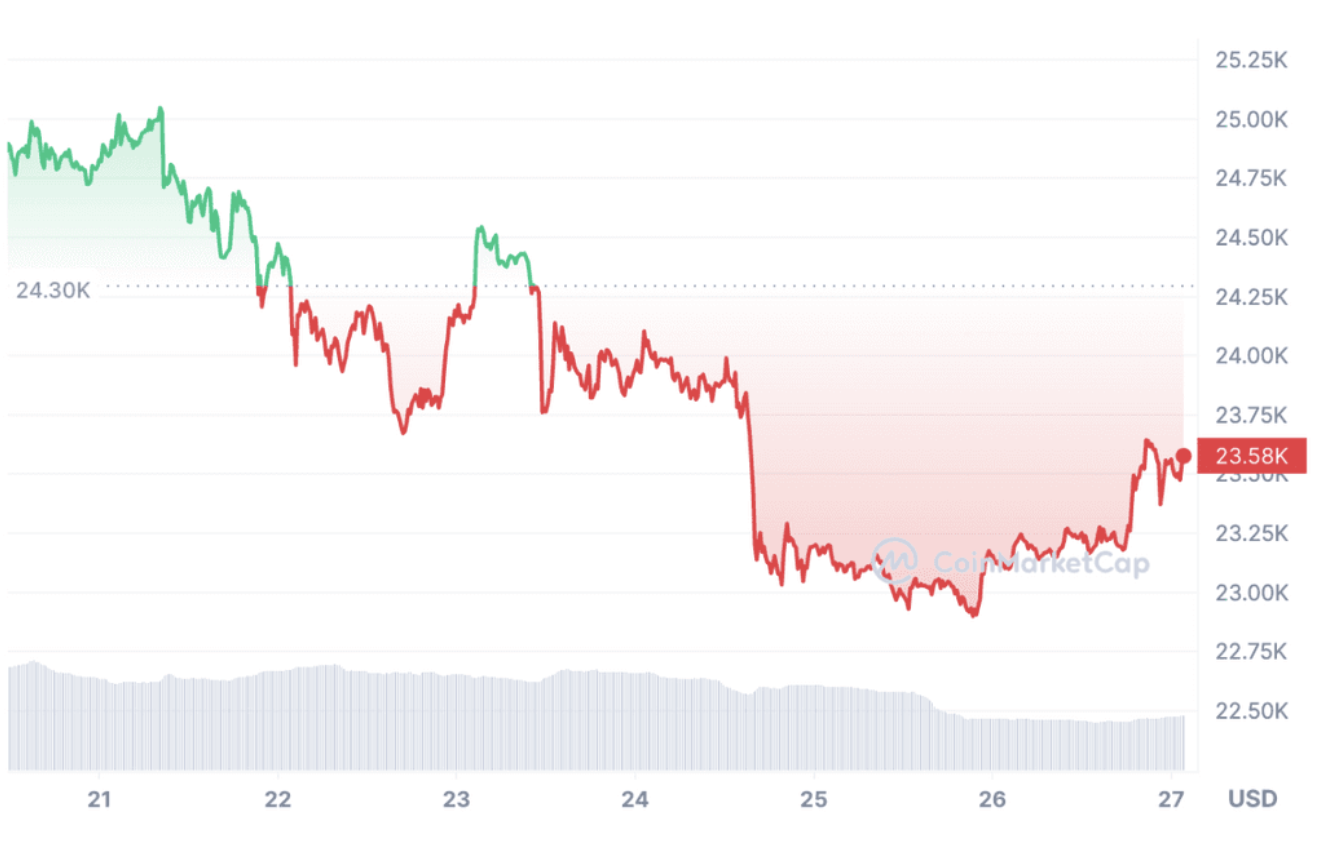
Opening the week at $24.83k, Bitcoin remained strong, pushing above the $25k threshold and reaching a weekly high of $25,026. However, on the 22nd, BTC began to fall, with sharp spikes in valuation pushing it below its 7-day SMA and into the upper $23k region. Toward the 23rd, BTC began to demonstrate signs of a rebound, having pushed toward $24.5k, yet this was swiftly disrupted, with the 24th highlighting a weekly resistance zone of $24k, which forced it into the trenches of the lower $23k region. As a result, BTC price reached a weekly low of $22,931.
Having resumed the downward trading trajectory that has plagued Bitcoin throughout the start of February, Bitcoin appears to be forming a correctional trading pattern that is pushing it to stagnate between $22k-$23k. In total, BTC fell by 3.04% this week.
Ethereum (ETH)
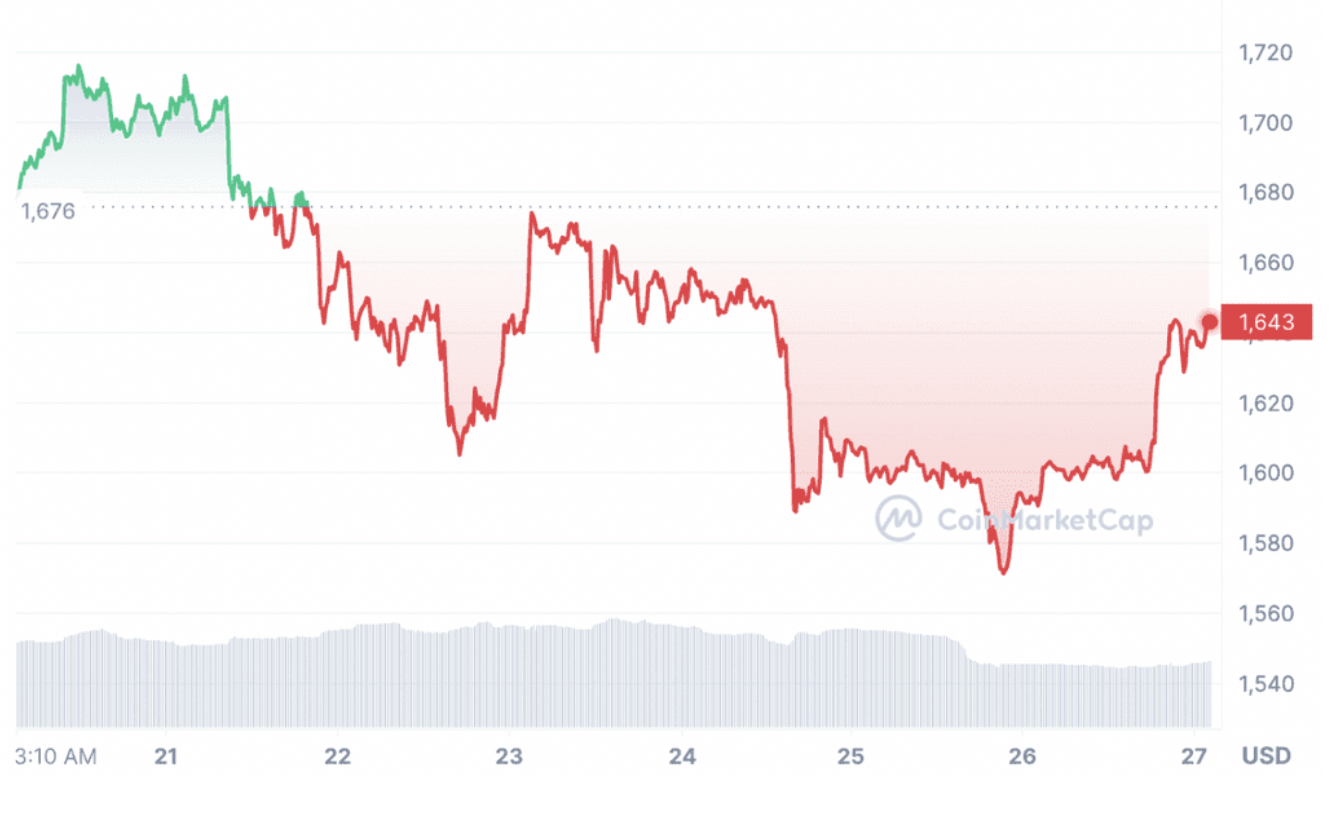
Having started the week hovering above its 7-day SMA at $1,676, ETH price remained healthily above its 7-day SMA and pushed toward the $1,720 resistance zone, and realized a weekly high of $1,714. However, Ethereum began to decline swiftly toward the opening of the 22nd, forcing it below $1,620 by the close of the day. The 23rd granted Ethereum some leeway, as it began to push toward the 7-day SMA and trade horizontally, yet this was disrupted as ETH plummeted to a weekly low of $1,572. However, the close of the week has granted Ethereum some upward momentum and led it to close the week at $1,642.
Having deviated from its recent trend of losing value in the earlier portion of the week before accelerating in value, Ethereum appears to have re-entered a correctional trading trajectory. However, with Ethereum beginning to move upward at the end of the week, it is possible that the coming week might allow Ethereum to re-test the $1,700 zone and push upward. In total, Ethereum fell by 1.89% this past week.
XRP (XRP)
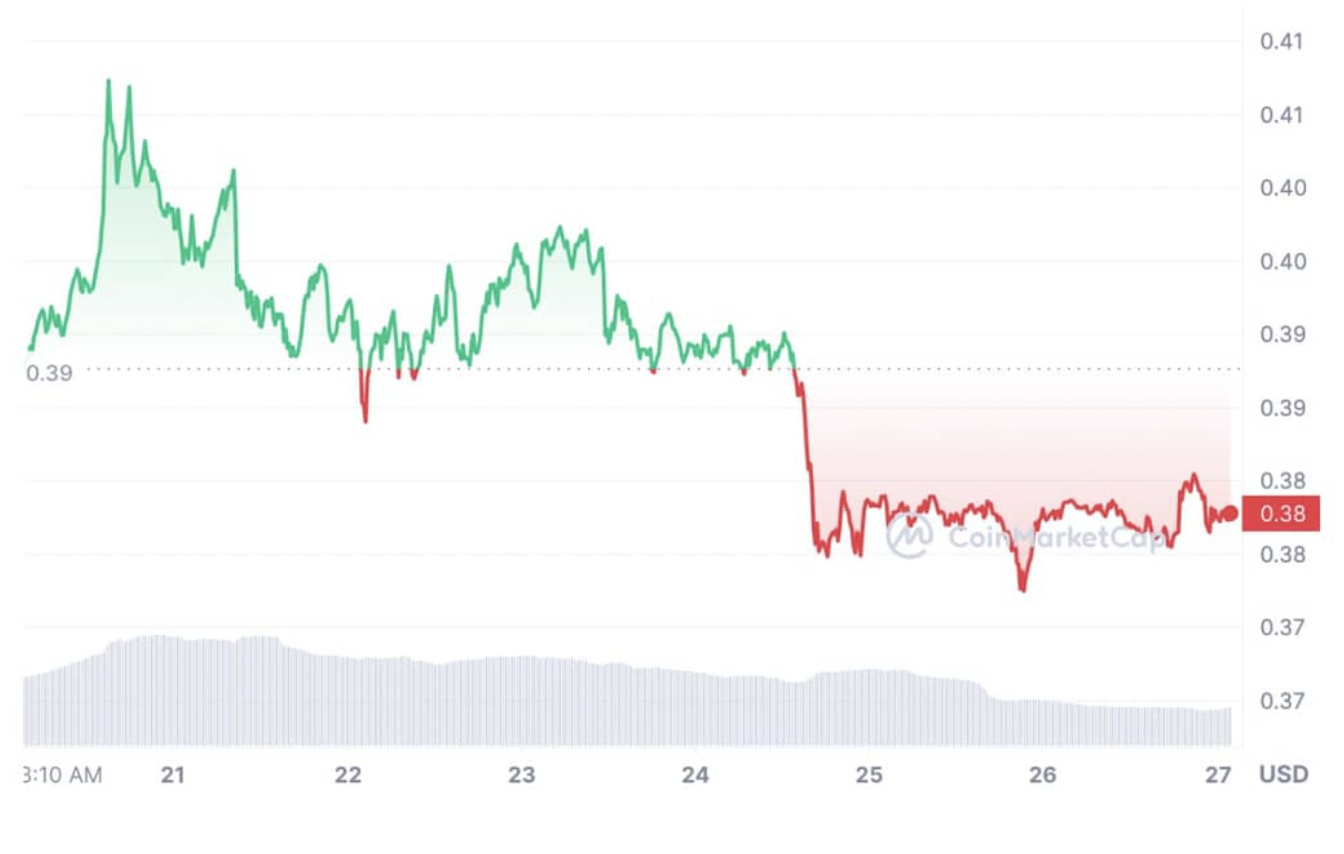
Entering the week at $0.39, XRP was subject to immense volatility throughout the earlier portion of the week, which led it to sharply swing upwards and reach a weekly high of $0.407. XRP then began to decline, yet remain consistently between $0.39 and $0.4 until the 24th. On the 24th, XRP began to demonstrate signs of stagnation, which led it to plummet below $0.38 and reach a weekly low of $0.3725 on the 26th. XRP then closed the week teetering on the cusp of the $0.38 region.
With this immense volatility, XRP will likely continue to experience this in the coming weeks, which can be correlated with the imminent SEC vs Ripple lawsuit verdict, which has resulted in mixed sentiment throughout the XRP community, as well as the wider cryptocurrency world. It is likely in the coming week that XRP may enter and demonstrate a similar level of volatility following an initial period of horizontal trading activity. Across the past week, XRP price fell by 2.52%.
Cardano (ADA)
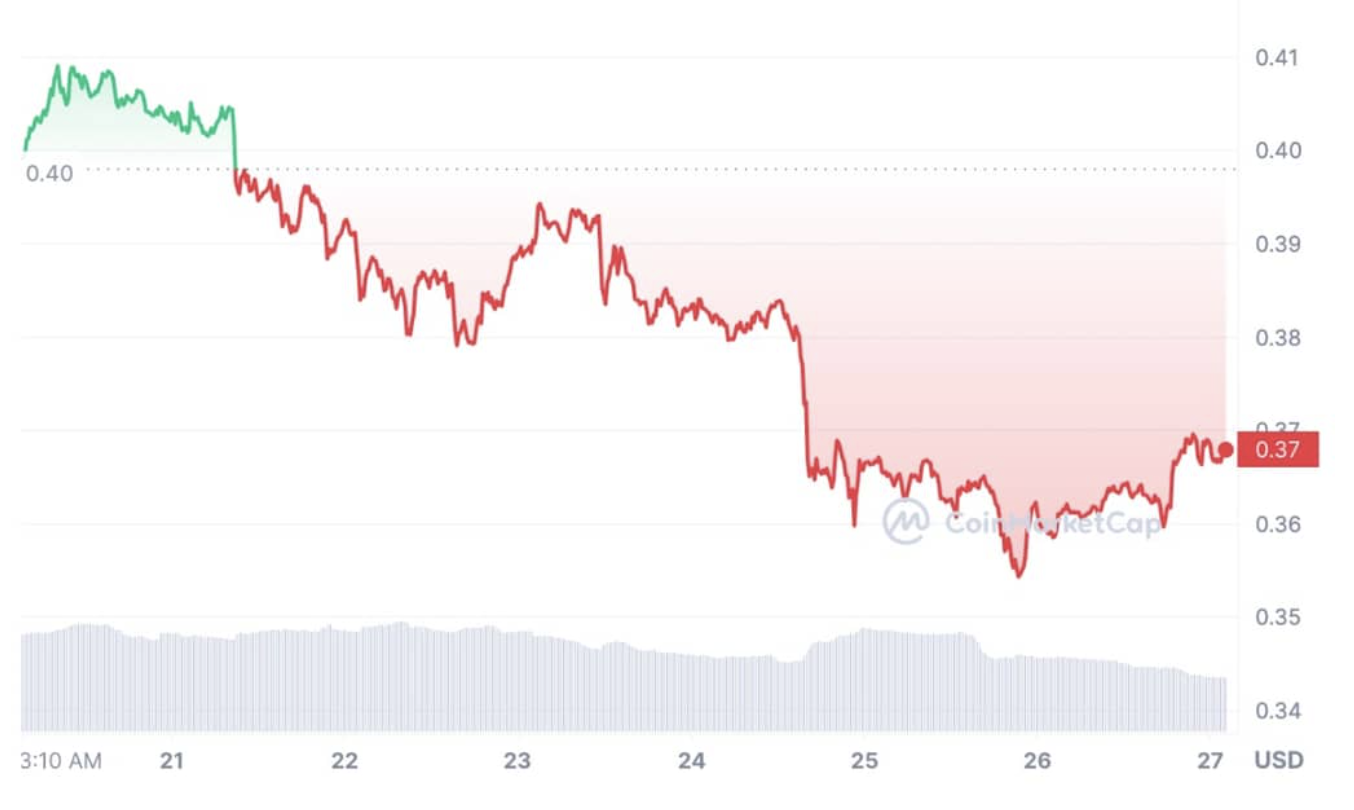
Across the past week, Cardano has been subject to immense volatility, with it entering the week on the cusp of the 7-day SMA at $0.40. ADA then began to push against the $0.41 resistance zone before entering a progressive downward price trajectory that ensued throughout the remainder of the week. However, on the 24th, ADA was subject to a sharp decline, which pushed it to a weekly low of $0.3543 on the 26th, with ADA maintaining a similar price level as the week closed.
With a sudden bearish momentum, ADA appears to have fixated on a downward price trajectory that is likely to ensue throughout the coming week considering the newly established resistance near the $0.37. Across the past week, Cardano price decreased by 7.52%.
BNB (BNB)
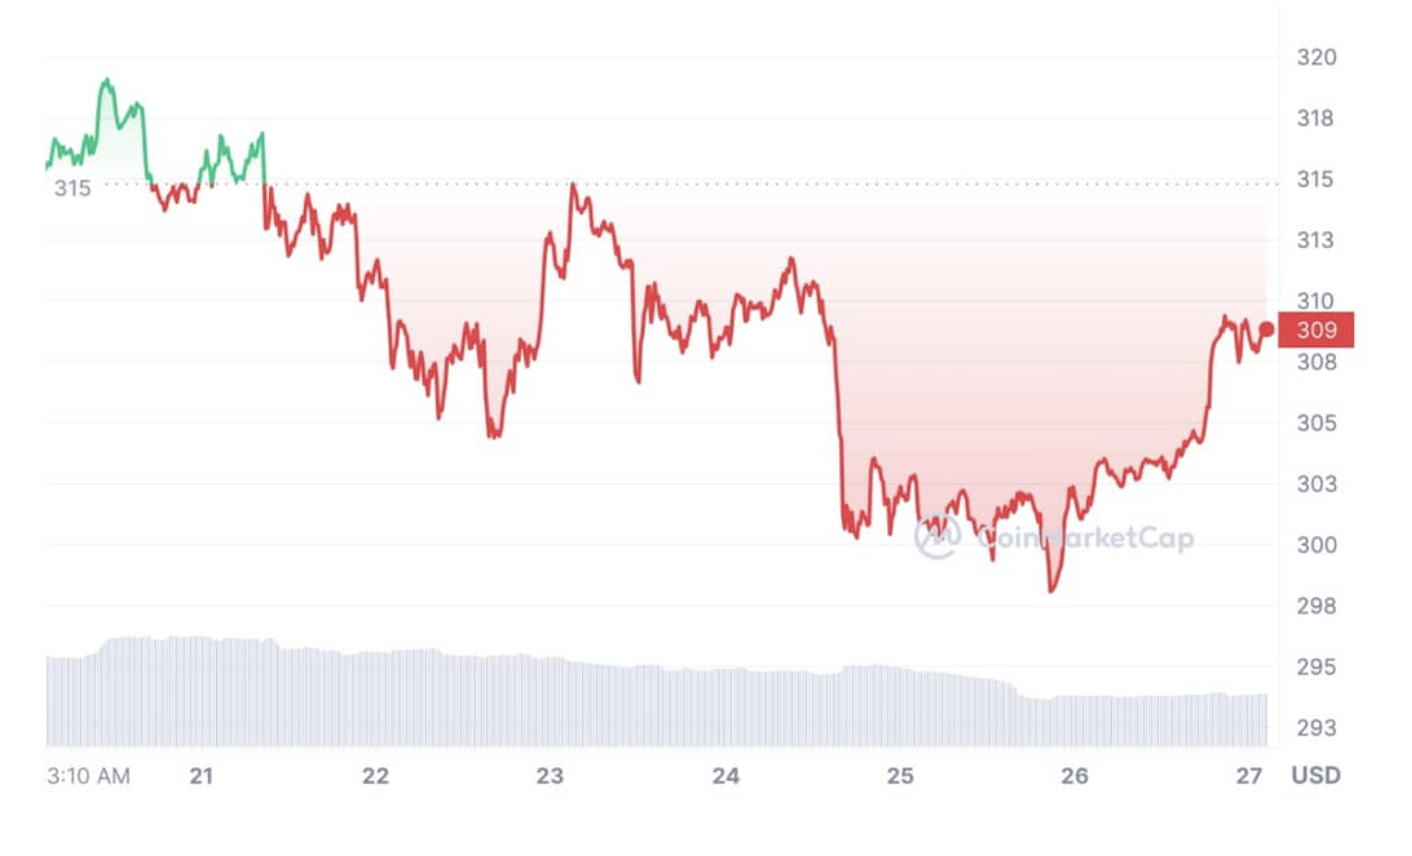
Across the past week, BNB has been subject to substantial volatility once again. Entering the week at $315, BNB price remained above its 7-day SMA and pushed against the $320 zone. However, on the 21st, BNB was subject to immense volatility and volleyed above and below the 7-day SMA threshold before progressively declining toward $305. The 23rd offered some respite for BNB, allowing it to move towards the cusp of its 7-day SMA, before once again resuming the progressive downward trend. This led BNB price to plummet below $300 and reach a weekly low of $298.13.
The substantial volatility witnessed by BNB this week and the week prior is likely to extend into the coming week, suggesting that it is likely BNB will continue to be forced below $300, with little sign of it pushing through the newly established resistance zone of $320. Across the past week, BNB has decreased by 1.94%.
Notice: Information contained herein is not and should not be construed as an offer, solicitation, or recommendation to buy or sell securities. The information has been obtained from sources we believe to be reliable; however, no guarantee is made or implied with respect to its accuracy, timeliness, or completeness. Authors may own the cryptocurrency they discuss. The information and content are subject to change without notice. Visionary Financial and its affiliates do not provide investment, tax, legal, or accounting advice.
This material has been prepared for informational purposes only and is the opinion of the author, and is not intended to provide, and should not be relied on for, investment, tax, legal, accounting advice. You should consult your own investment, tax, legal, and accounting advisors before engaging in any transaction. All content published by Visionary Financial is not an endorsement whatsoever. Visionary Financial was compensated to submit this organic article. Please also visit our Privacy policy; disclaimer; and terms and conditions page for further information.