The S&P 500 surged to a new record high on Wednesday. However, market breadth told a different story beneath the surface. Fewer than half of the components advanced despite strong index performance.
Mr. Schneider at ArcheInvest highlights how megacap technology stocks drove disproportionate gains. The concentration in a handful of names raised sustainability questions. Historical patterns showed narrow rallies typically lacked durability.
The Breadth Deterioration
The advance-decline line failed to confirm the index breakout to new highs. The divergence suggested underlying weakness masked by large-cap strength. Technical analysts viewed this pattern as a concerning signal.
Only 205 stocks advanced while 297 declined despite a positive index close. The math worked because the largest companies carried the heaviest index weighting. Market-cap weighting methodology amplified the impact of mega-caps.
The Concentration Risk
The top ten S&P 500 companies accounted for an outsized portion of the index value. The concentration reached levels rarely seen historically. A few stocks determined the index direction regardless of the broader market.
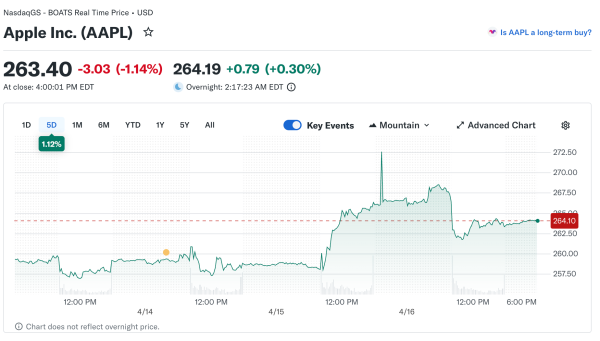
Microsoft, Apple, Nvidia, Amazon, and Alphabet dominated the index composition. Their collective performance overwhelmed the other 495 companies. The structural imbalance created fragility in market leadership.
The Equal-Weight Performance
The S&P 500 Equal Weight Index significantly underperformed the market-cap version. The divergence quantified how poorly the average stock performed versus the index. Investors buying equal-weight products experienced a different reality.
The equal-weight approach provided a better representation of typical stock performance. The underperformance suggested most companies struggled despite index strength. Active managers faced a challenging environment when benchmarked to cap-weighted indices.
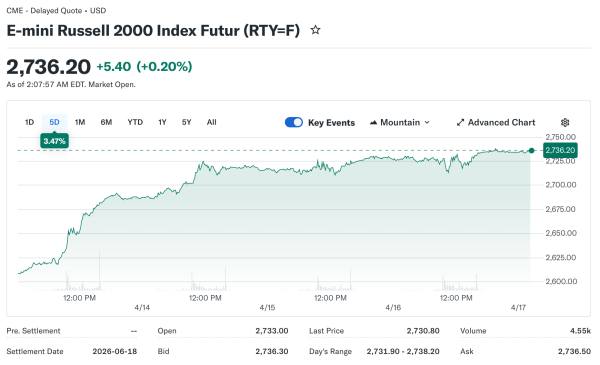
The Small-Cap Struggle
The Russell 2000 barely budged, gaining just 0.04% while large caps soared. Small-capitalization stocks failed to participate in the rally. The divergence highlighted a preference for quality and liquidity.
Economic uncertainty hit smaller companies harder than diversified giants. Credit access more challenging for firms with limited resources. The risk-off sentiment favored established leaders.
The Sector Dispersion
Technology and communications dominated gains while other sectors lagged. Energy, healthcare, and consumer staples posted modest advances or declines. The sector rotation proved narrow and concentrated.
Within sectors, performance dispersion widened as winners and losers diverged. The variance created challenges for sector-based investment strategies. Stock selection mattered more than sector allocation.
The Volume Analysis
Trading volume remained below average despite milestone price levels. The muted participation suggested limited conviction in the rally. Heavy volume typically accompanied sustainable advances.
Algorithmic trading dominated volume, with retail participation mixed. The institutional caution evident in reduced trading activity. Risk managers maintained defensive positioning despite index strength.
The New Highs-Lows
Stocks making new 52-week highs failed to expand materially. New lows remained elevated relative to typical bull market conditions. The ratio suggested market health was weaker than the price suggested.
Breadth thrust indicators measuring a surge in advancing stocks didn’t trigger. The technical signals historically reliable for confirming rallies. Absence of confirmation raised yellow flags.
The Moving Average Tests
Many individual stocks traded below key moving averages despite index strength. The 200-day moving average crossovers showed a mixed picture. Broad participation in uptrends is lacking.
The percentage of stocks above moving averages remained depressed. The indicator measuring market internals showed weakness. Technical analysts monitored for improvement, confirming rally sustainability.
The Leadership Rotation
Previous market leaders in energy and financials faded as technology rebounded. The rotation demonstrated sector leadership instability. Sustainable bull markets typically featured broadening participation over time.
Defensive sectors like utilities and consumer staples underperformed. The risk-on sentiment favored growth over stability. However, participation remained confined to select growth names.
The Historical Context
Previous narrow rallies in 2000 and 2007 preceded significant corrections. The concentration in a few stocks occurred before market tops. Pattern recognition suggested caution was warranted.
However, some periods featured narrow leadership that broadened subsequently. The outcomes varied, making historical comparison an imperfect guide. Context and fundamentals mattered for determining trajectory.
The Fundamental Support
Earnings growth concentrated in the technology sector, justifying relative strength. Megacap companies posted superior profit growth versus the average stock. The fundamental divergence explained some of the performance gap.
Valuation multiples expanded for market leaders while compressing elsewhere. The bifurcation reflected confidence in secular growth drivers. Quality premium widened during uncertain periods.
The International Comparison
Global markets showed similar concentration in technology leaders. The phenomenon not unique to US equities. Worldwide investors favored a handful of dominant companies.
Emerging markets struggled to attract capital despite cheaper valuations. The quality and growth scarcity commanded premium pricing. Geographic diversification provided limited benefit.
The Passive Flow Impact
Index fund inflows amplified concentration by mechanically buying the largest stocks. The feedback loop reinforced the dominance of mega-caps. Market structure changes contributed to narrowing leadership.
Active managers struggled to outperform as index concentration increased. The structural headwinds facing stock selection strategies. Fee pressure on active management intensified.
The Forward Outlook
Breadth improvement is required for sustainable advancement to continue. Watching for participation expansion among sectors and stocks. Technical indicators provide early warning signals.
Fundamental catalysts like earnings growth and broadening would support breadth. Economic stability allows more companies to perform. Patience required for market internals to heal.