


Most market participants are familiar with the concept of diversification, and how losses in one asset can be offset by gains in another asset. Diversification generally lowers the overall risk profile of the portfolio by reducing the returns that happen at the extremes (tails of the distribution). The same techniques can be applied to the cryptocurrency markets. Do you know the return distribution of your cryptocurrency portfolio?
Crypto Analysis – Portfolio Simulation Tool
In order to demonstrate this concept, we are going to make use of the free portfolio simulation tool over at CryptoDataDownload.com . This tool allows you to select a dollar ($) value invested allocation across asset(s), and immediately see the expected PnL (Profit and Loss) distribution of returns both in a histogram and a data table underneath.
A positive $ value means that you have bought the crypto asset (long). A negative $ value means that you have gone short the asset (sold with intention to re-buy).
(*Please note that shorting cryptocurrency is only possible via futures or derivatives markets, and includes other risks not covered in this article).
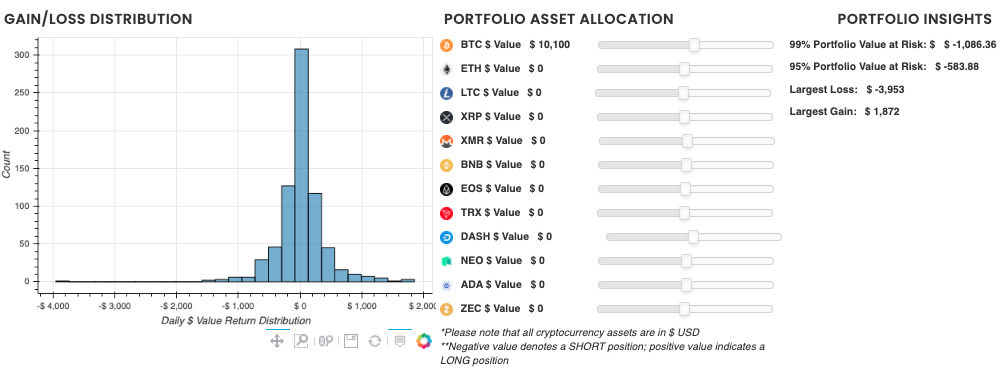
For example, a $10,100 position in BTC has a return distribution that looks like the below. Notice how the histogram has a value that seems pretty extreme compared to the rest of the values (far left point). This ‘tail loss’ represents the worst loss in the simulation using the last two years of returns, and occurred on 3/12/20. The 99% Portfolio Value at Risk is -$1,086 — VaR can be interpreted to mean that:
“Statistically speaking, this portfolio has a 1% chance of experiencing a loss of at least $1,086 over the next one day period.”
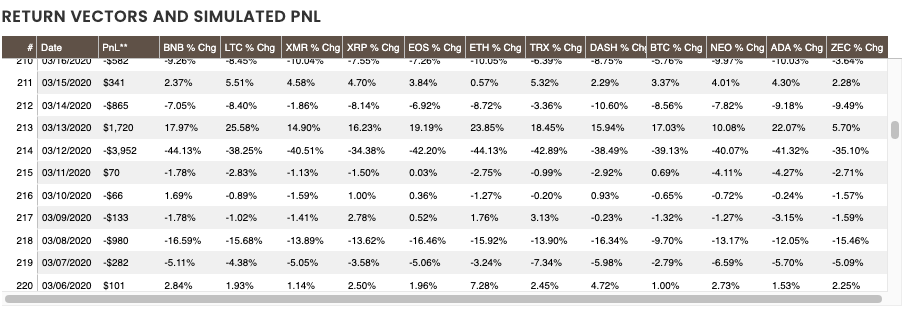
We can view the actual simulated PnL vectors/values that drive the histogram in the data table below; these are sorted by the worst PnL events. Notice that on 3/12/20, almost every cryptocurrency asset lost at least 34%.
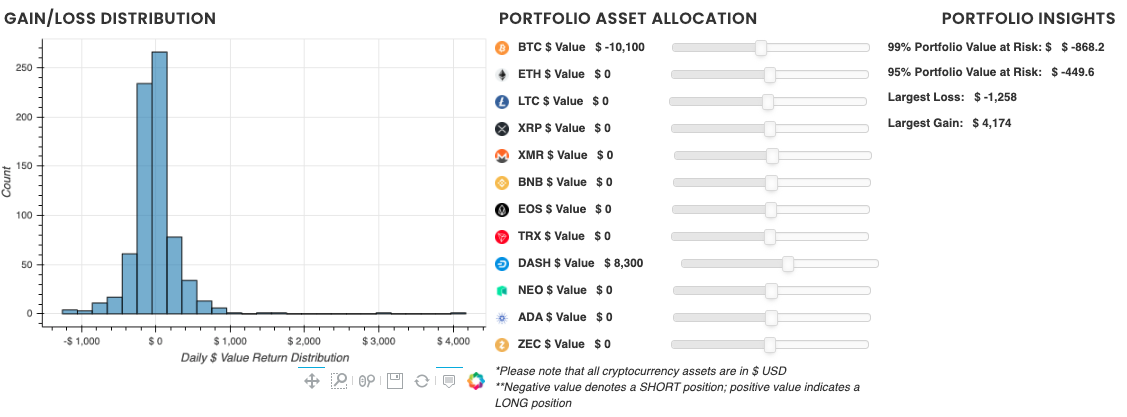
Now what happens to the expected returns if we try a different combination(s) of portfolio assets? Instead of being long $10,100 BTC, we will go SHORT $10,100 worth of BTC (again, only possible via futures markets). This time we will also add a long investment of $8,300 in DASH.
Our new long/short portfolio distribution looks like the below. What may be noticeable right away is that our histogram has shifted, and now has a strong right skew; meaning there are more extreme positive returns than negative returns. Our 99% VaR value has fallen by ~$200, which indicates that our long/short portfolio is slightly less risky than owning BTC outright (diversification). The largest loss for this simulated portfolio is now $1,258; a decrease of over $2,500! Most notable may be that the portfolio gains are now also skewed to the upside! Largest gain now is $4,175 vs $1,872 previously.
Are you able to find other portfolio allocations that would indicate a positive skew in the portfolio return distribution? Check out our free tool to preform your own crypto analysis. Also, if you would like to read more about Value at Risk, please see our previous article concerning MicroStrategy and their BTC position.
Notice: Information contained herein is not and should not be construed as an offer, solicitation, or recommendation to buy or sell securities. The information has been obtained from sources we believe to be reliable; however no guarantee is made or implied with respect to its accuracy, timeliness, or completeness. Authors may own the crypto currency they discuss. The information and content are subject to change without notice. Visionary Financial and its affiliates do not provide investment, tax, legal or accounting advice.
This material has been prepared for informational purposes only and is the opinion of the author, and is not intended to provide, and should not be relied on for, investment, tax, legal, accounting advice. You should consult your own investment, tax, legal and accounting advisors before engaging in any transaction. All content published by Visionary Financial is not an endorsement whatsoever. Visionary Financial was not compensated to submit this article Please also visit our Privacy policy; disclaimer; and terms and conditions page for further information.