


Bitcoins price recently hit a new yearly high after surging to key resistance levels at $15,800. For the last week, technicals have looked extremely bullish for Bitcoin. With the recent jump, what price levels could signal an event where traders start to take profits and drive Bitcoins price into a “cool down?”
Bitcoins Price
At the time of this report, Bitcoins price is currently trading at $15,732. The largest digital asset by market cap has rallied +8.6% over the last 24hrs, and +17% the last week. Many argue that FOMO is flocking into Bitcoin, especially since BTC has just cracked a new yearly high. If we take a look at the price, BTC is now trading at the highest level since January 2018. In addition, Bitcoins market dominance is 66%, which is a level it has not seen since early this year. Since the beginning of this week, Bitcoin has experienced an influx of buying, pushing the price up from $13,500 levels all the way to $15,800. With buyers flooding the market, is BTC approaching overbought territories?
Bitcoin Technical Analysis
A couple of days ago, Bitcoin powered through $14,000 resistance, which added a lot of fuel based on historical price action. At the time of that report, it was noted that Bitcoin could very well test $15,800 resistance in the short-term. This was based on various market fundamentals and the fact that ROC ( rate of change ) indicators were flashing green. With $15,800 resistance being tested shortly after that call, traders are now watching for a potential pullback.
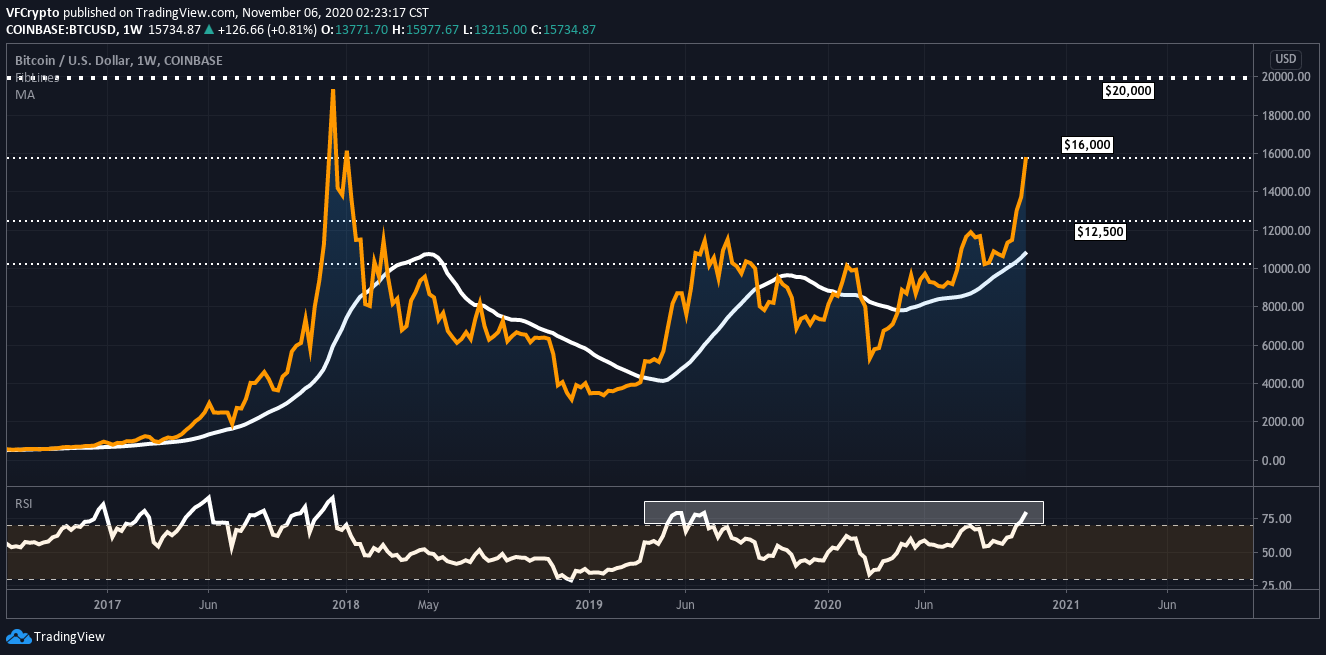 With the recent rally, it is hard to disregard RSI levels. At the time of this report, Bitcoins RSI has approached 80 levels ( bottom of the chart ), which denotes overbought territories. Based on the charts, this is the highest RSI Bitcoin has put in since June of 2019. With this being said, Bitcoin could be gearing up for a pullback in the short term. When RSI was at these levels in 2019, we saw that pullback that followed shortly after.
Bitcoin could experience some heavy volatility in the short term based on current support and resistance levels. With the recent surge, it has created a bigger gap in terms of important support and resistance levels. Bitcoin is currently knocking on the door at $15,800 resistance but is displaying weakness. Many argue that BTC could experience another leg up if $15,800 resistance can be accepted. Given the current overbought status, this is hard to imagine, but there is a lot of FOMO in BTC right now as all-time highs are approaching. Many traders could be placing buy orders right above $16,000 to reduce their chances of missing out on another leg up. On the flip side, if BTC rejects $15,800 resistance, it could experience high volatility. We say this because solid support is all the way down around $12,500 regions. Retesting these levels is not out of the equation given the recent surge.
Bitcoin And The Dollar
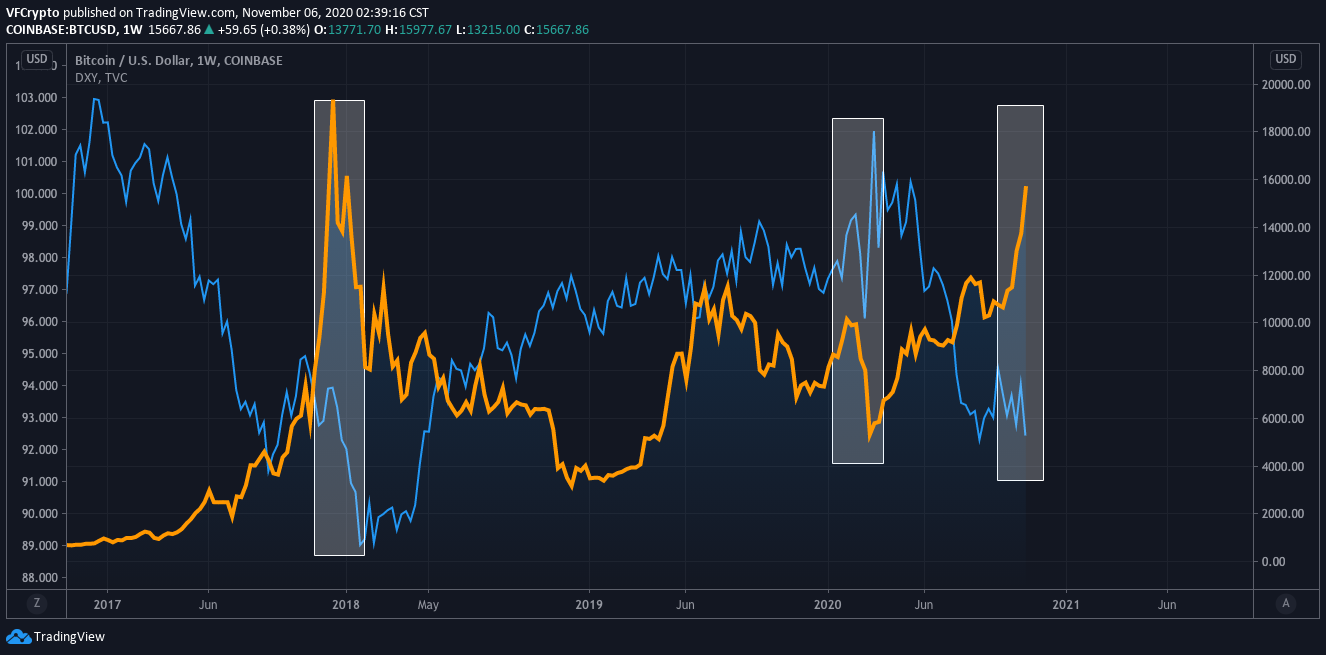
We have stressed for a while that the Dollar is a major catalyst for Bitcoin right now. With BTC and the USD having a strong inverse relationship, the recent weakness in the Dollar is providing BTC momentum. With the Presidential elections throwing all sorts of curveballs at the market, the Dollar is experiencing elevated weakness. If the Dollar continues to have bearish sentiment, we do think it could result in BTC cracking $15,800 resistance, but due to BTC being highly overbought, we remain cautious in the short-term and believe Bitcoin is due for a pullback unless it has a strong push above $15,800.
Notice: Information contained herein is not and should not be construed as an offer, solicitation, or recommendation to buy or sell securities. The information has been obtained from sources we believe to be reliable; however no guarantee is made or implied with respect to its accuracy, timeliness, or completeness. Authors may own the crypto currency they discuss. The information and content are subject to change without notice. Visionary Financial and its affiliates do not provide investment, tax, legal or accounting advice.
This material has been prepared for informational purposes only and is the opinion of the author, and is not intended to provide, and should not be relied on for, investment, tax, legal, accounting advice. You should consult your own investment, tax, legal and accounting advisors before engaging in any transaction. All content published by Visionary Financial is not an endorsement whatsoever. Visionary Financial was not compensated to submit this article Please also visit our Privacy policy; disclaimer; and terms and conditions page for further information.