

Following the initial sell-off last Wednesday, Bitcoin price has struggled to re-test $50,000 levels. After Tesla announced they halted BTC as a payment method for their vehicles, negative sentiment was injected into the market. This sent BTC prices to an 11-week low as investors questioned ESG factors around Bitcoin. Aside from fundamental FUD, we continue to look at Bitcoin from a technical standpoint. What price levels will traders and investors be watching next week? We outline important support and resistance levels.
Bitcoin Price
At the time of this report, Bitcoin is currently trading at $46,978. The largest cryptocurrency by market cap has fallen ~ 19.8% over the last week. Additionally, Bitcoin price has tanked ~ 25% over the last month. Visionary Financial recently showed the precipitous decline in BTC’s market dominance on a year-to-date basis. Bitcoin’s market dominance recently fell to levels not seen since June 2018. Altcoins have been capitalizing in this environment, with large-cap alts like Ethereum growing market dominance ~ 88% YTD.
#Crypto Market Dominance – #Bitcoin now at the lowest level since June 2018. 👀
YTD Metrics: #BTC -39% 💤#ETH +88% 🚀#XRP +58% 🚀 pic.twitter.com/hFTMNkUC9Y
— Visionary Financial (@VisionaryFinanc) May 13, 2021
As mentioned above, Bitcoin’s sudden drop last week seems to be directly correlated to Tesla and Elon Musk. After questioning the environmental cost of mining Bitcoin, negative sentiment poured into the digital asset. Musk had stated that:
“We are concerned about rapidly increasing use of fossil fuels for Bitcoin mining and transactions, especially coal, which has the worst emissions of any fuel,” Musk said in a note posted on Twitter Wednesday. “Cryptocurrency is a good idea on many levels and we believe it has a promising future, but this cannot come at great cost to the environment.”
Bitcoin Technical Analysis
While most of the market is following the Elon Musk FUD, we continue to focus on the technicals of Bitcoin. At the time of this report, $44,600 is the key support level for BTC. This is the support level that traders and investors should be watching going into next week. As long as this level can hold, Bitcoin could start to experience a reversal ( in a bullish manner ).
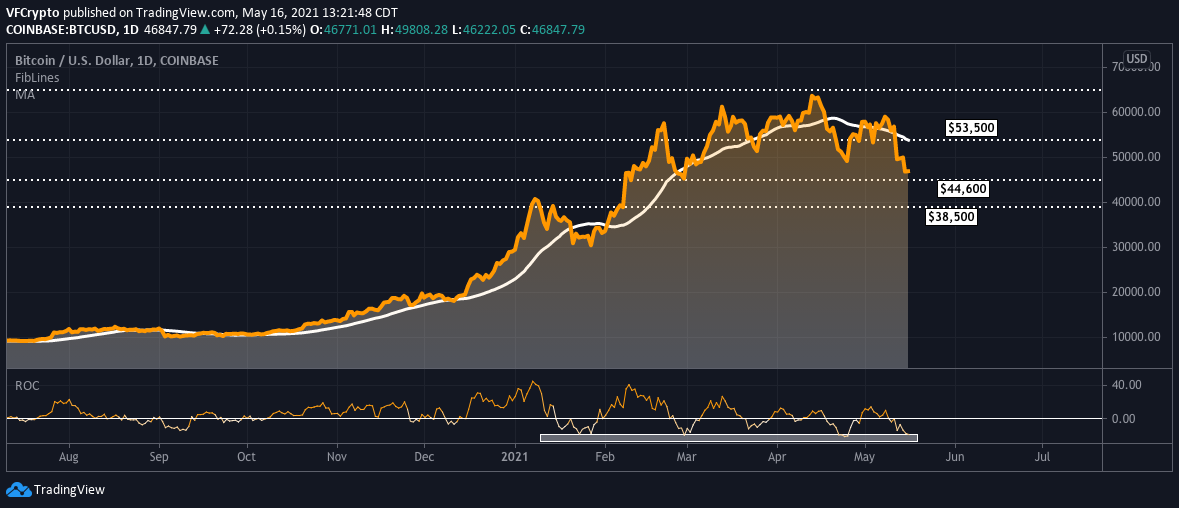
We have mentioned many times before that we focus on ROC ( rate of change ) technicals to assess BTC momentum. We have added the ROC indicator at the bottom of the chart above. BTC has obviously been experiencing negative momentum ( below 0.00 ROC ) since May 11th. Based on historical metrics, it seems like ROC may be bottoming. This could mean a reversal is in route. For those unfamiliar, we sense bullish momentum when ROC starts to hover above 0.00.
On the contrary, Bitcoin could continue to sell off with increased FUD. If BTC rejects $44,600 support, we believe it could fall to $38,500 levels before reversing sentiment.
We remain bullish in the short-term unless $44,600 support is rejected as outlined above.
Notice: Information contained herein is not and should not be construed as an offer, solicitation, or recommendation to buy or sell securities. The information has been obtained from sources we believe to be reliable; however, no guarantee is made or implied with respect to its accuracy, timeliness, or completeness. Authors may own the cryptocurrency they discuss. The information and content are subject to change without notice. Visionary Financial and its affiliates do not provide investment, tax, legal, or accounting advice.
This material has been prepared for informational purposes only and is the opinion of the author, and is not intended to provide, and should not be relied on for, investment, tax, legal, accounting advice. You should consult your own investment, tax, legal, and accounting advisors before engaging in any transaction. All content published by Visionary Financial is not an endorsement whatsoever. Visionary Financial was not compensated to submit this article Please also visit our Privacy policy; disclaimer; and terms and conditions page for further information.