

We take a look at Bitcoin price, Ethereum price, and XRP price for the week of January 15, 2021. Aside from fundamentals, we rely heavily on technical analysis to assess overall sentiment. This is achieved by identifying key support and resistance levels that traders and investors will be watching in the short term.
Bitcoin Price
At the time of this report, Bitcoin price is currently sitting at $36,423. As projected in last week’s analysis, Bitcoin was due to experience a sharp sell-off. Over the last week, Bitcoin has fallen ~ 10.8% following a strong start to 2021. The largest digital asset by market cap has still experienced ~ 24% growth over the last month.
Bitcoin Technical Analysis
If we review last week’s report, it was mentioned that Bitcoin technical analysis was showing strong support levels around $39,000. We strongly believed that BTC would experience a sharp pull-back if this level was rejected. This theory came to fruition as BTC rejected $35,000 and sold off to a low of around $32,500 last week. Following a decent recovery throughout the week, we now believe $35,000 will be the next support level that investors and traders are watching in the short-term.
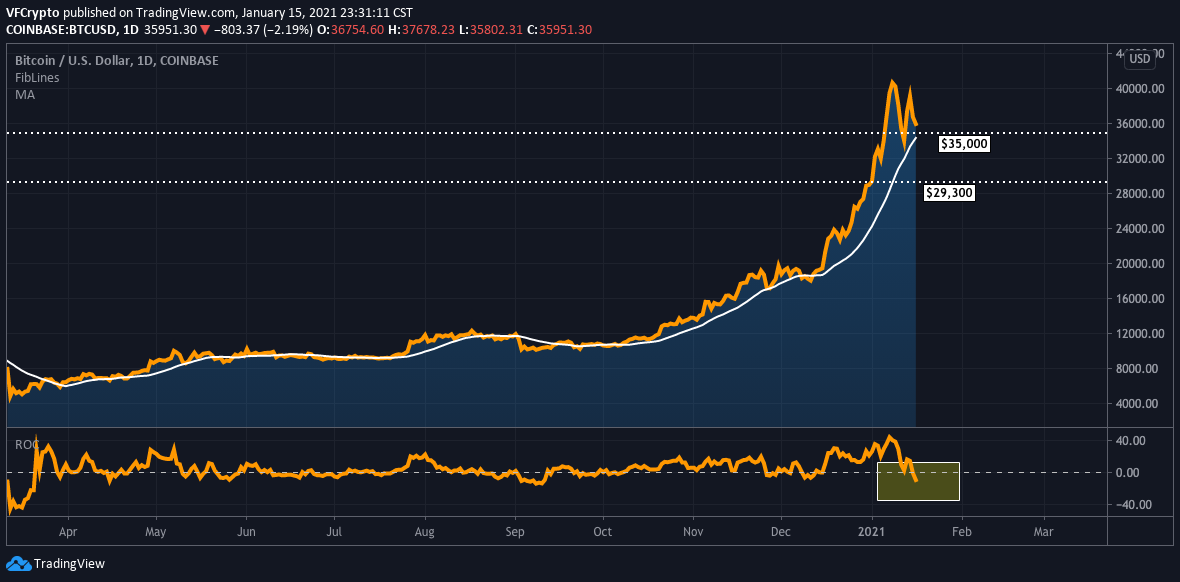
You could very well see another sharp sell-off if BTC rejects $35,000 levels. If this were to happen, we believe that Bitcoin could test $29,300 in the short-term. On the contrary, we believe bulls can retain control if BTC stays above $35,000. The one unappealing metric right now is the ROC ( rate of change ) displayed at the bottom of the chart. BTC has recently entered negative territories which denotes bearish momentum.
Ethereum Price
At the time of this report, Ethereum is currently trading at $1,161. The second-largest digital asset by market cap outperformed Bitcoin last week, falling ~ 5% compared to Bitcoins ~ 10.8% sell-off. Among large-cap digital assets, Ethereum has still been the outlier over the last month. ETH has experienced ~ 82.8% growth during the last 30 days.
Ethereum Technical Analysis
In the prior weeks Ethereum Analysis, it was mentioned that conviction was high in ETH right now, especially since the digital asset was inching closer to all-time highs. Ethereum last hit its all-time high in January 2018 when it cracked $1,448. Based on recent price action, we saw a very similar trajectory and still believe ETH will outperform in the short-term despite the minor pullback last week.
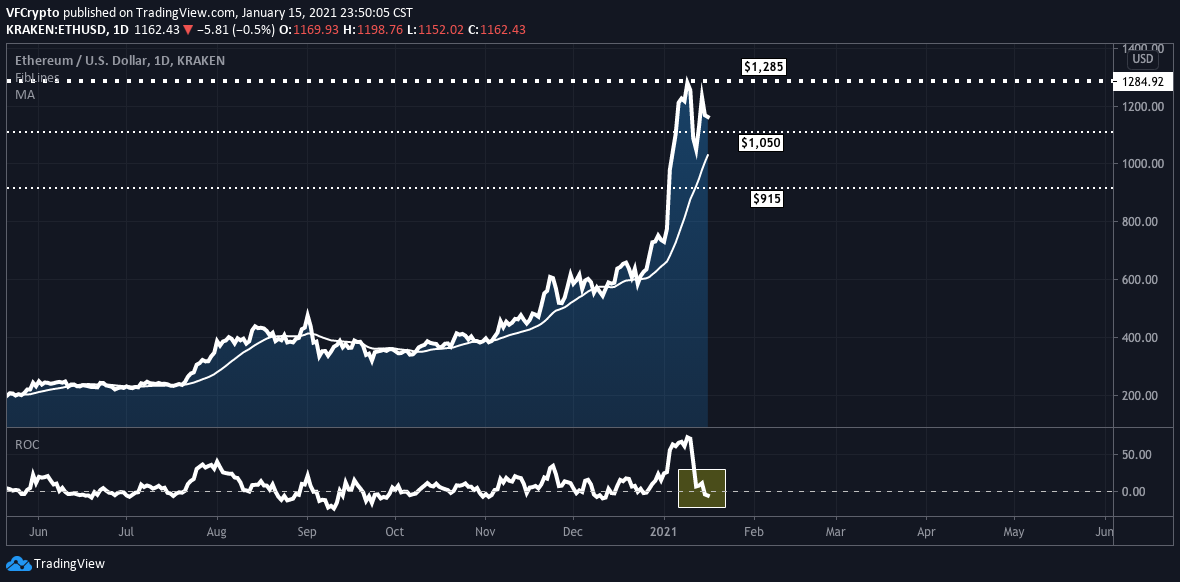
As long as Ethereum can stay above $1,050 support, we believe $1,285 resistance will be retested in the short-term. If this were to happen, watch ETH gear up to test those all-time highs mentioned above. On the flip side, investors and traders will be managing risk by keeping $1,050 support on their radar. If ETH rejects this level, we could see a solid dip based on the recent parabolic price action. If we compare Ethereums ROC ( rate of change ) to Bitcoins, we quickly see that Bitcoins are lower. ETH is right around 0.00 which is neutral momentum. The next bull leg up will start after Ethereums ROC gets back into the positive ( anything above 0.00 ).
XRP Price
At the time of this report, XRP is currently trading at $0.277. Over the last week, XRP has underperformed Bitcoin and Ethereum with a ~ 13.6% decline. Additionally, XRP has fallen ~ 51% during the last 30 days. The fifth-largest digital asset by market cap is still trying to find positive momentum despite the on-going Ripple / SEC developments. As mentioned in last week’s XRP analysis, investors are still deploying risk capital into XRP with it offering a large potential upside if the lawsuit against Ripple is dropped. It’s virtually impossible to predict this timeline, but it’s evident that investors deploying capital into XRP right now have a strong conviction, with many of them fully aware that XRP could potentially lose much more value if things don’t go Ripple’s way legally. This is all about risk vs reward right now.
XRP Technical Analysis
We previously mentioned that XRP should continue to experience upward momentum as long as $0.17 support is not rejected. Based on recent price action, we have lifted that support level to $0.20, meaning we believe XRP will remain bullish unless $0.20 support is rejected.
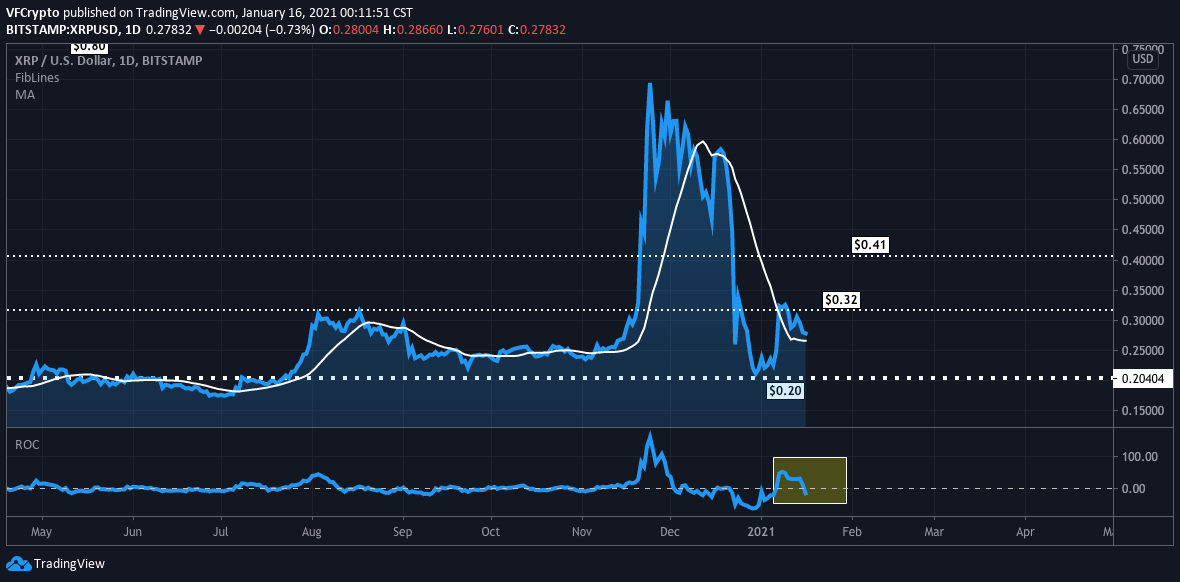
As long as prices can stay above $0.20 support, watch for XRP to test $0.32 resistance in the short-term. A rally above these levels could push the digital asset to $0.40 levels. On the contrary, if XRP rejects $0.20, this could spark a lot of red flags. Based on the current metrics, there seems to be selling pressure lined up below $0.20 levels. We would have to see XRP’s behavior at those levels before making any other short-term predictions. As of now, we remain bullish as long as the XRP price holds above $0.20.
Notice: Information contained herein is not and should not be construed as an offer, solicitation, or recommendation to buy or sell securities. The information has been obtained from sources we believe to be reliable; however no guarantee is made or implied with respect to its accuracy, timeliness, or completeness. Authors may own the crypto currency they discuss. The information and content are subject to change without notice. Visionary Financial and its affiliates do not provide investment, tax, legal or accounting advice.
This material has been prepared for informational purposes only and is the opinion of the author, and is not intended to provide, and should not be relied on for, investment, tax, legal, accounting advice. You should consult your own investment, tax, legal and accounting advisors before engaging in any transaction. All content published by Visionary Financial is not an endorsement whatsoever. Visionary Financial was not compensated to submit this article Please also visit our Privacy policy; disclaimer; and terms and conditions page for further information.