


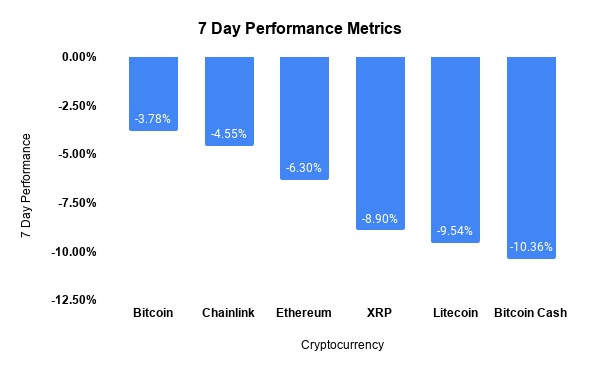
XRP price has fallen -8.90% the last 7 days, following most altcoins to the downside. As XRP price inches closer to $0.26 support levels, what technicals should be on watch right now? We outline some important levels that traders and investors will be watching in the near term.
XRP Price
At the time of this reporting, XRP is trading at $0.2654, which is down about -3.60% over the last 24hr. XRP is following the market trend, as most cryptocurrencies in the top 25 by market capitalization have sold off the last week.
XRP Price And Volume
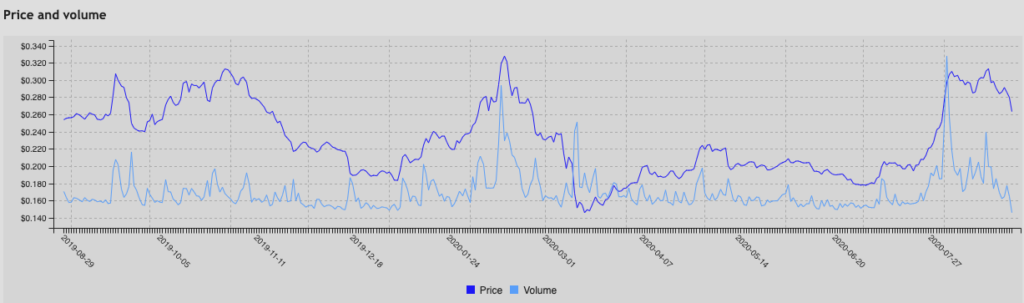
So far this year, XRP price has struggled to crack strong resistance around $0.35 levels. The bull rally in late July had strong volume, but ultimately marked the second time since late February that XRP failed to rally above $0.35 resistance.
Despite XRP being up +16.50% over the last month, we have recently seen a sell-off that has slashed year to date momentum. In addition, XRP trade volume is seeing some of the lowest levels of the year which is pushing down sentiment. In the chart below, it’s evident that low trade volumes are a primary catalyst behind bearish price action right now. Similar to many other cryptocurrencies, price sentiment typically follows volume. In the chart below, there is a clear representation of this over time.
XRP Technical Analysis
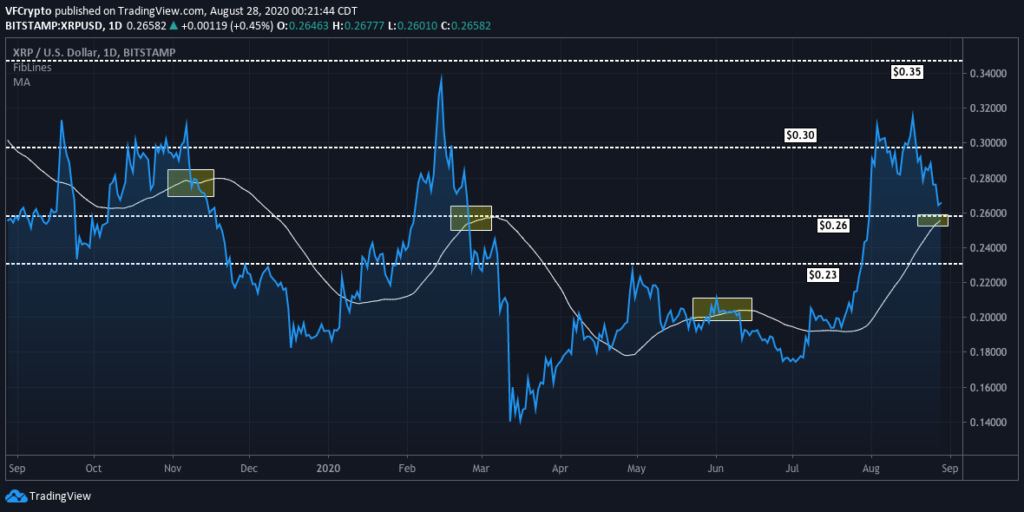
With XRP price approaching strong support levels at $0.26, this will be an important price level that could be crucial in the near term. If XRP price fails to hold this level, you could very well see another strong leg down.
Why Is $0.26 An Important Level?
If we look at historical price action this year, $0.26 has been an important support level two other times. In mid November and March, we see above that XRP rejected $0.26 support levels and saw significant sell-offs.
- November $0.26 rejection = -35% sell-off
- March $0.26 rejection = -46% sell-off
50 Day Moving Average
In the chart above, we can also see that the 50 day moving average is hovering right around the $0.26 price level. During the most previous sell-off in March, you saw the same exact setup where the 50 day moving average sat right at $0.26. With this being said, it will be extremely important to watch this level in the near term. Based on historical price action, it is best believed that XRP could go into a stronger bear mode if it rejects these levels.
On the flip side, XRP could very well bounce off $0.26 and build even stronger support. As long as it does not close below this level, many believe this recent sell-off was “natural” and that XRP could be gearing up for another push to resistance at $0.30. As discussed above, trade volume will also be important to watch with XRP. With trade volume coming in at some of the lowest levels of 2020, it is expected for this to reverse sooner or later.
XRP Price Performance
- 7 Day: -8.90%
- 30 Day: +11.77%
- 90 Day: +31%
- 1 Year: +4.3%
Notice: Information contained herein is not and should not be construed as an offer, solicitation, or recommendation to buy or sell securities. The information has been obtained from sources we believe to be reliable; however no guarantee is made or implied with respect to its accuracy, timeliness, or completeness. Authors may own the crypto currency they discuss. The information and content are subject to change without notice. Visionary Financial and its affiliates do not provide investment, tax, legal or accounting advice. This material has been prepared for informational purposes only and is the opinion of the author, and is not intended to provide, and should not be relied on for, investment, tax, legal, accounting advice. You should consult your own investment, tax, legal and accounting advisors before engaging in any transaction. All content published by Visionary Financial is not an endorsement whatsoever. Visionary Financial was not compensated to submit this article Please also visit our Privacy policy; disclaimer; and terms and conditions page for further information.