Taurus One precious metals specialist Benjamin Chase breaks down silver’s worst single-session collapse on record, examining the technical damage and what $80 per ounce means for traders expecting further downside.
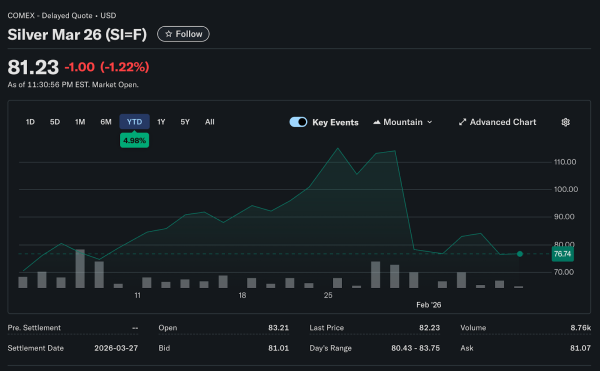
Friday delivered a trading session that will appear in commodities textbooks for decades. Silver crashed 28% in a single day, marking the most severe decline in the metal’s documented price history. Not during the 2008 financial crisis. Not in the 1980s, Hunt Brothers collapsed. This topped them all in sheer magnitude and speed.
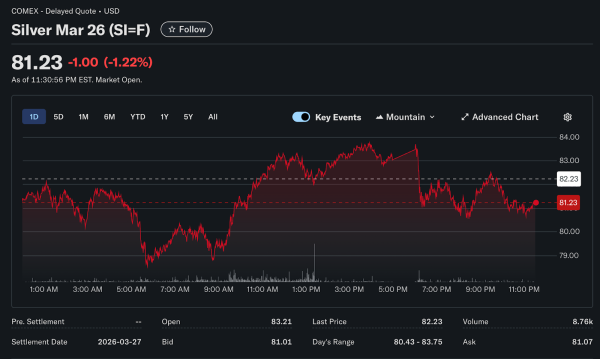
The move wasn’t a gradual deterioration over hours. It was a violent liquidation that overwhelmed every support level in what felt like minutes to traders watching screens. Spot silver that opened Friday near $111 per ounce closed around $80, erasing months of gains in one chaotic session that left participants stunned.
BTIG’s Brutal Forecast
Jonathan Krinsky, BTIG’s chief market technician, issued a stark warning that few traders want to hear. He expects silver to test $55 per ounce, the primary breakout level from earlier consolidation patterns.
That implies another 31% decline from the current $80 levels. Not a minor pullback to work off overbought conditions. Not routine volatility that creates buying opportunities. A complete retracement of the entire rally that drove precious metals enthusiasm and attracted speculative capital.
Krinsky notes silver could see “choppiness in the $80 to $100 range” before the next leg lower. This suggests sideways consolidation rather than immediate collapse, but the ultimate destination points significantly lower regardless of near-term bounces.
What $55 Represents Technically
The $55 level marks where silver decisively broke out from multi-month consolidation earlier in the cycle. Technical analysts view primary breakout zones as critical support during corrections because they represent where conviction buyers initially entered.
If prices return to breakout levels after failed rallies, it often signals that the entire advance lacked fundamental support. Traders who bought the breakout face complete round-trip losses, destroying the credibility of the pattern and creating seller psychology at any bounce attempt.
Current price action shows silver finding temporary support around $80. But this zone offers little historical significance beyond being a round number. It’s simply where panicked selling paused for breath, not where committed buyers stepped in with size.
The Macro Forces Behind Precious Metals Weakness
Rising Treasury yields undermine precious metals valuations systematically. When risk-free government bonds offer 4.28% yields with full faith and credit backing, non-yielding assets like silver lose relative attractiveness in portfolio construction models.
The Federal Reserve’s cautious stance on rate cuts compounds the problem for metals bulls. Markets initially priced aggressive easing in 2026 based on economic weakness assumptions. Now expectations moderate as economic data shows resilience and inflation persists above target levels.
Silver also faces industrial demand questions that gold avoids. The metal serves both as a precious metal investment and an industrial input for electronics manufacturing and solar panel production. Slowing global manufacturing growth outside the United States pressures this demand component substantially.
Mining Stocks Get Crushed
Silver mining equities amplify metal price moves through operational leverage embedded in business models. When silver falls 28%, mining stocks often decline 40% to 50% as profit margins compress dramatically and marginal operations face existential threats.
Companies that expanded production based on $110 silver price assumptions now face $80 prices with higher operating costs from inflation. Many marginal operations become unprofitable quickly, forcing production cuts or asset sales.
Capital allocation decisions made during the rally now look questionable in hindsight. Mines that began development expecting sustained high prices may need to halt projects or raise expensive capital to complete them, diluting existing shareholders.
The Contrarian Case Needs Evidence
Some analysts will argue that extreme fear creates buying opportunities for patient capital. They’ll cite oversold technical indicators and sentiment extremes as proof that a bottom approaches. These arguments aren’t necessarily wrong, just premature without confirming evidence.
Successful bottom-fishing requires capitulation signals that haven’t appeared yet. Volume needs to spike as final sellers exit in panic. Volatility needs to compress as price stabilizes and contracts. Time needs to pass for market participants to regain confidence after trauma.
None of these conditions currently exists in silver markets. The metal remains volatile with wide intraday ranges. Volume stays elevated, reflecting continued uncertainty. Technical damage extends across multiple timeframes from daily to monthly charts.
What Happens Next Matters More
Near-term price action likely involves choppy trading between $75 and $85 without clear directional conviction. Neither bulls nor bears have clear control following such a violent move that surprised both sides.
The critical test comes if silver approaches $75 on any weakness. A clean break below that level probably accelerates selling toward BTIG’s $55 target as remaining weak holders capitulate. Conversely, a decisive hold followed by recovery above $85 might suggest the worst has passed.
Correlation with other commodities provides additional clues about causation. If crude oil, copper, and industrial metals also weaken substantially, it confirms broad commodity deflation. If silver declines in isolation, it suggests metal-specific factors dominate.