The BTC/USD pair has remained remarkably stable this week, even as institutional demand accelerates through spot exchange-traded funds (ETFs). Currently trading around 75,300, Bitcoin has gained approximately 26% from its year-to-date low, signaling a resilient uptrend despite short-term consolidation. In this article, ArcheInvest’s brokers present a detailed and easy-to-understand overview of the subject.
This price compression is not indicative of weakness; rather, it reflects a classic continuation pattern forming in the market. The emergence of an ascending triangle suggests that bullish pressure is steadily building, with buyers consistently stepping in at higher levels. Such formations are often precursors to breakout rallies, particularly when supported by strong fundamental inflows.
ETF Inflows Continue to Drive Institutional Demand
One of the most significant drivers behind Bitcoin’s price stability has been the sustained inflow into spot Bitcoin ETFs. Recent data shows that these funds have recorded six consecutive days of inflows, pushing total monthly inflows to nearly $2 billion, a notable increase from the previous month’s $1.32 billion.
Since their inception, these ETFs have accumulated over $58 billion in inflows, with total assets under management (AUM) surpassing the $100 billion mark. Specifically, spot Bitcoin ETFs alone account for more than $65 billion in inflows, currently holding around $61.52 billion in assets.
This surge underscores a broader institutional adoption trend, as traditional investors increasingly view Bitcoin as a store of value and a portfolio diversification tool. The consistent capital injection into ETFs has effectively created a price floor, limiting downside volatility while supporting long-term upward momentum.
Corporate Accumulation Adds Further Support
Beyond ETFs, corporate accumulation has also played a pivotal role in Bitcoin’s recent performance. A major contributor is the ongoing Strategy buyout, which has significantly boosted market confidence.
The company recently acquired Bitcoin worth over $2.54 billion, bringing its total holdings to an impressive 815,062 BTC. At current market prices, these holdings are valued at over $61 billion, with the firm’s net asset value (NAV) rising to 0.89.

Such large-scale accumulation reduces the circulating supply, intensifying the supply-demand imbalance that often drives prices higher. This trend reinforces the broader bullish narrative, as fewer coins remain available for trading on the open market.
Technical Analysis: Ascending Triangle Signals Breakout Potential
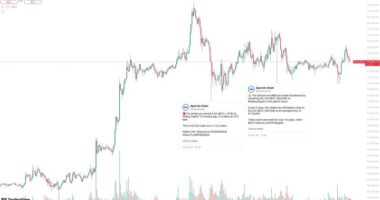
From a technical perspective, Bitcoin’s chart structure reinforces the bullish outlook. The daily chart reveals that BTC/USD has been trading within a tight range, forming an ascending triangle pattern, a structure characterized by higher lows and a horizontal resistance level.
This pattern typically indicates that buyers are gaining strength, gradually absorbing selling pressure at the resistance level.
Key Technical Indicators
Key technical indicators continue to support a bullish outlook for Bitcoin. The price has moved above both the 50-day and 100-day Exponential Moving Averages (EMA), confirming a strong upward trend, with these levels now acting as dynamic support zones. Additionally, Bitcoin remains above the Supertrend line, indicating that buyers are in control of the market.
From a Fibonacci perspective, the asset is currently hovering near the 23.6% retracement level, which is often seen as an early stage of trend continuation. Momentum indicators further reinforce this view, as the Relative Strength Index (RSI) is trending upward without entering overbought territory, suggesting there is still room for upside, while the MACD continues to display positive divergence, highlighting sustained bullish momentum.

Price Targets and Scenarios
Price Targets and Scenarios suggest that, given the current setup, the most probable outcome is a bullish breakout above the triangle resistance. The first upside target lies at the 38.2% Fibonacci retracement level around 85,750, which represents the next key resistance zone.
If Bitcoin manages a successful breakout above this level, it could advance toward the second upside target at the 50% retracement level near 93,587, marking a significant medium-term milestone. Such a move would likely be supported by continued ETF inflows, institutional demand, and positive market sentiment.
Risk Factors and Bearish Scenario
Despite the optimistic outlook, traders should remain cautious of potential downside risks.
A break below the ascending trendline support would invalidate the bullish pattern, signaling a possible shift in market sentiment. In such a case, Bitcoin could retrace toward the year-to-date low of 60,000.
Key risks to watch include a sudden decline in ETF inflows, macroeconomic shocks or tighter monetary policy, and increased regulatory pressure on crypto markets.
Conclusion: Bullish Bias Remains Intact
In summary, Bitcoin’s price consolidation is not a sign of weakness but rather a strategic pause within a broader uptrend. The combination of strong ETF inflows, institutional accumulation, and a bullish technical setup points toward a likely upside breakout.
As long as the ascending triangle structure holds and key support levels remain intact, the BTC/USD pair is well-positioned to continue its bullish trajectory in the near term.