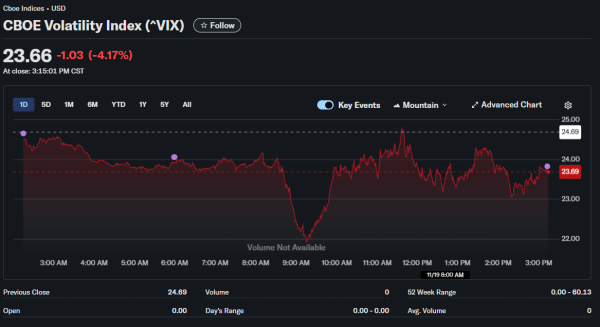
Wall Street’s anxiety barometer registered its sharpest increase in over a month as turbulence returned to equity markets with sudden intensity. The CBOE Volatility Index, universally known as the VIX, jumped 14.2% to settle at 20 levels, marking the largest single-day surge since early October. Finance experts at Unirock Gestion analyze what the fear gauge spike signals about market psychology and potential future price action.
According to technical analysis frameworks, readings above 25 indicate markets are entering deeper anxiety territory that historically precedes sharper selloffs. While current levels remain below that threshold, the velocity of the recent increase warrants attention from risk managers.
The VIX movement correlates closely with the Nasdaq Index, containing the largest technology companies, which currently hovers near its 50-day moving average at the time of assessment.
Technical Breakdown Threatens Support
The technology-heavy index broke above this moving average last April, signaling prices were advancing within short and medium-term ranges. Returning to test this technical level from above raises questions about whether the uptrend remains intact or has exhausted itself. Technical traders watch moving average interactions closely as they often mark inflection points between bullish and bearish regimes.
Trading volumes climbed substantially beyond recent norms, demonstrating extensive participation in the selloff rather than thin market conditions. The amplified activity suggests authentic portfolio repositioning rather than illiquidity-driven price dislocations. Intermediaries managed orderly trading despite fierce selling intensity, though market makers widened bid-ask spreads reflecting increased uncertainty.
Within-day price swings touched extreme territories with leading indexes oscillating through unusually wide ranges. These violent fluctuations created complications for algorithmic trading systems and momentum following strategies that struggled to adapt to rapidly changing conditions. Multiple securities experienced exceptional turbulence requiring temporary trading halts under circuit breaker protocols.
Decliners substantially outnumbered advancers across major exchanges by meaningful ratios. This breadth deterioration indicates selling pressure spread broadly rather than concentrating in isolated pockets. When market internals weaken alongside headline indexes, it suggests more pervasive risk aversion rather than sector-specific concerns.
Multiple Uncertainties Converge
Global financial markets approach a critical turning point regarding future direction. Anxiety remains elevated as participants await the December interest rate decision that will clarify whether the Federal Reserve continues its easing cycle or pauses to assess economic conditions. Upcoming corporate earnings face major tests as investors scrutinize whether results justify current valuations.
Forthcoming economic statistics will receive intense examination after the extended period without official data releases. Observers will parse employment reports, inflation figures, and growth estimates, searching for clues about underlying momentum. Any significant surprises in either direction could trigger outsized market reactions given elevated uncertainty levels.
The next price movements will reveal considerable information about what lies ahead. Markets positioned defensively suggest participants anticipate potential additional weakness.
However, contrarian indicators sometimes emerge when pessimism reaches extremes. Determining which scenario prevails requires monitoring not just price action but also underlying fundamentals.
Some technical analysts argue that current conditions resemble the late stages of healthy corrections rather than the beginning phases of bear markets. They note that despite recent weakness, major indexes remain well above key long-term support levels. Pullbacks to moving averages often provide attractive entry points during secular bull markets.
Options Markets Signal Heightened Hedging
Derivatives markets reflected surging appetite for downside protection as participants rushed to hedge portfolios against further declines. Options premiums expanded meaningfully, particularly for put options providing insurance against additional losses. This demand imbalance between puts and calls creates the mathematical foundation underlying VIX calculations.
When investors bid aggressively for protective options, implied volatility measures increase mechanically. The VIX represents a weighted average of implied volatilities across S&P 500 index options. Rising VIX, therefore, signals not just price declines but specifically increased demand for portfolio insurance relative to historical norms.
Historical Context Matters
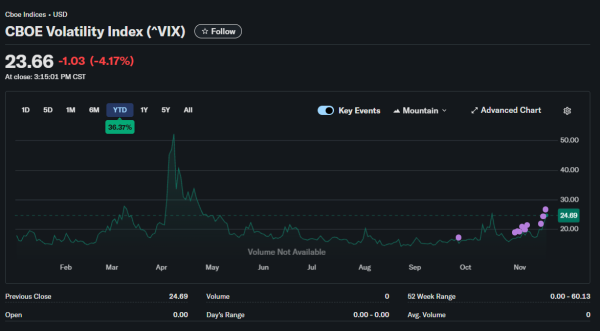
While current VIX levels around 20 represent elevated readings relative to recent tranquil periods, they remain modest compared to genuine crisis episodes. During the 2008 financial crisis, the VIX exceeded 80. March 2020 pandemic panic saw readings above 60. Even the 2011 European debt crisis pushed volatility above 40.
This historical perspective suggests current conditions reflect uncertainty and position adjustment rather than systemic crisis. Markets are repricing risk premiums upward from previously compressed levels, but haven’t entered panic modes requiring emergency policy intervention. The distinction matters for determining appropriate investor responses.
What Comes Next
Financial analysts emphasize that volatility spikes create both risks and opportunities depending on positioning and time horizons. Short-term traders face challenging conditions when price swings widen unpredictably. Long-term investors may find attractive entry points emerge during periods of maximum pessimism.
The key involves distinguishing temporary volatility from sustained fundamental deterioration. Current elevated uncertainty stems largely from information gaps and policy ambiguity rather than an obvious economic crisis. As these uncertainties resolve through data releases and central bank communications, volatility should moderate accordingly.