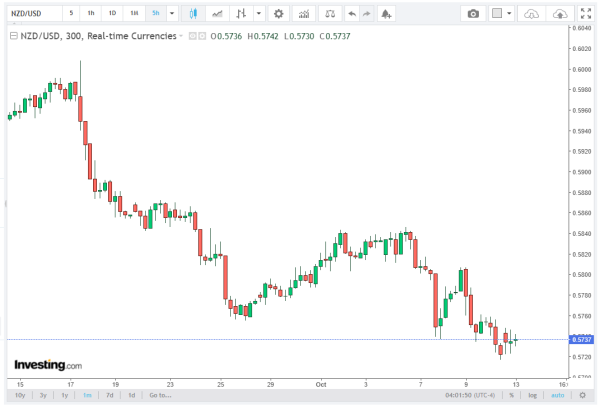
The NZD/USD currency pair continues to show bearish momentum, trading below key resistance levels and facing challenges in regaining upward traction. As of early European hours on Monday, the pair hovers around 0.5740, marking its fifth successive session of losses.
Technical indicators suggest that while a short-term oversold condition exists, the broader trend remains under pressure. The brokers at Arbitics simplify complex concepts in this comprehensive article.
Current Technical Setup
The daily chart reveals that NZD/USD is moving within a descending wedge pattern, a formation often characterized by declining momentum and potential for a bullish reversal. Typically, within such a pattern, trading volume decreases, reflecting a loss of momentum in the prevailing bearish trend.
The nine-day Exponential Moving Average (EMA), currently located near 0.5750, acts as the initial resistance barrier. The pair’s inability to break above this EMA highlights the ongoing short-term weakness in NZD/USD.
Meanwhile, the 14-day Relative Strength Index (RSI) remains slightly below the 30 level, indicating that a bearish bias is active. The RSI’s proximity to oversold territory suggests that although downside momentum is strong, the pair may be poised for a corrective bounce if buying interest emerges.
Key Support Levels
On the downside, the psychological level of 0.5700 serves as the initial support for the pair. This is a critical technical area, as traders often place stop-loss and take-profit orders around round numbers, reinforcing its significance.
Below this level, the lower boundary of the descending wedge, near 0.5690, provides additional support. A break below this wedge could confirm a continuation of the bearish trend, opening the path toward 0.5485, the lowest level since March 2020, last observed on April 9, 2025.
Technical analysts note that a sustained decline below 0.5700 may trigger further downside pressure, encouraging momentum traders to target key historical lows. This would solidify the bearish sentiment and potentially accelerate the pair’s move toward the medium-term support zone.
Resistance and Recovery Potential
On the upside, the first barrier lies within the 0.5750–0.5775 range, marked by the nine-day EMA. Overcoming this resistance is critical for the NZD/USD pair to signal any potential bullish reversal.
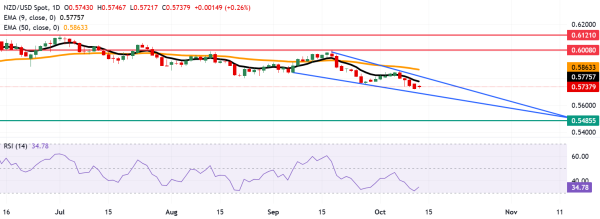
Further resistance is seen at the upper boundary of the descending wedge, around 0.5830. A break above this level would indicate a shift in market sentiment, enabling the pair to test the 50-day EMA, currently near 0.5863.
Such a move would enhance medium-term price momentum, providing traders with a clearer picture of a potential trend reversal. Technical experts often monitor the confluence of EMAs and wedge boundaries as crucial zones to gauge trend strength and market psychology.
Short-Term Price Momentum
The NZD/USD continues to struggle with short-term momentum, trading below the nine-day EMA. This suggests that bearish pressure dominates the market, with buyers showing limited conviction.
The descending wedge pattern hints at a possible bullish breakout once the oversold RSI triggers buying interest. Traders may anticipate short-covering rallies, which could briefly lift the pair toward 0.5775–0.5830, but the broader market bias will remain influenced by the downward trendline.
Analysts often observe that oversold conditions near key support levels can result in volatile retracements, particularly in pairs like NZD/USD, which are sensitive to risk sentiment and macro data from New Zealand and the US.
Medium-Term Outlook
Looking ahead, a successful breach of the confluence resistance zone around 0.5775–0.5830 could shift NZD/USD into a bullish phase. This would allow the pair to test the three-month high of 0.6008, reached on September 17, followed by 0.6121, the highest since October 2024.
However, failure to surpass the nine-day EMA and the wedge’s upper boundary may reinforce the bearish bias, keeping the pair trapped within the descending channel. Traders should closely monitor technical indicators like RSI, EMAs, and wedge boundaries to assess entry and exit points.
Conclusion
The NZD/USD price forecast remains bearish in the short term as the pair trades below 0.5750, near the nine-day EMA. Immediate support is observed at the psychological 0.5700 level, while resistance lies at 0.5775 and the upper wedge boundary around 0.5830.
Technical indicators, including the 14-day RSI and descending wedge pattern, suggest that bearish pressure dominates, but the proximity to oversold territory leaves room for a potential corrective bounce. Traders should watch the key EMAs and wedge formations for signs of trend reversal or further downside continuation.
In summary, while NZD/USD may experience short-term retracements, the medium-term outlook hinges on whether it can surpass the confluence resistance zone, potentially opening the path toward 0.6008 and 0.6121.