

Chainlink, the 6th largest cryptocurrency by market cap, has experienced a ~ 3.6% drawdown over the last 24 hours. After failing to test key resistance levels, why could Chainlink price be heating back up in the short term? We take a look at the 1 year chart to further assess the technicals.
Chainlink Price
At the time of this report, Chainlink is currently trading at $12.30. Over the last 24 hours, the 6th largest digital asset by market cap has experienced a ~ 3.6% sell-off. In terms of performance metrics, LINK has seen significant growth over the last year, surging +350%. In the shorter term, LINK has rallied +25% the last month. Despite Bitcoin seeing solid growth over the last month, it has underperformed when compared to Chainlink. BTC saw +21% growth the last 30 days while LINK came in at +25%.
Chainlink Technical Analysis
Based on current technicals, LINK has been flashing a buy signal in the short term.
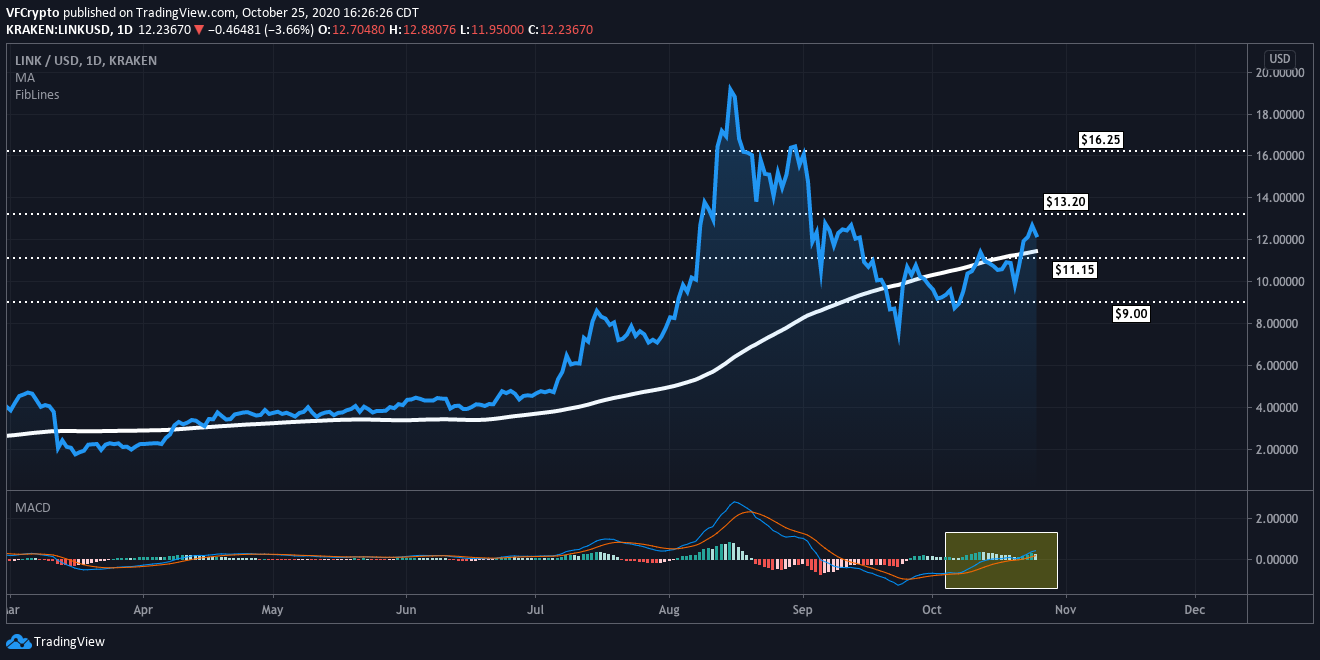
As we can see from recent price action, LINK recently failed to accept resistance at $13.20. Following that rejection, LINK was given the opportunity to “cool-down” and reset the technicals. LINK arguably approached overbought territories after its strong rally that originated on the 20th of October.
Most recently, LINK was flashing a buy signal based on its MACD setup. MACD which measures momentum, has crossed to the upside which is bullish in the shorter term. The recent sell-off in LINK availed the digital asset to normalize and reset a few technicals.
Two price regions on watch: $13.20 and $11.15.
If $13.20 resistance is accepted, LINK could very well have enough momentum to retest $16.25 levels. In the event this happens, it would represent potential +32% upside from current levels.
On the flip side, $11.15 support will be a support level that many traders are eyeing in the short term. Many traders are most likely setting up stop losses around this region based on technicals. If $11.15 was rejected, it could put significant pressure on price. At these levels, LINK most likely drops below the 100 day moving average which would be bearish. An event like this could result in LINK retesting $9 levels.
As long as LINK price remains above $11.15 support, the technicals are showing a relatively bullish environment.
Notice: Information contained herein is not and should not be construed as an offer, solicitation, or recommendation to buy or sell securities. The information has been obtained from sources we believe to be reliable; however no guarantee is made or implied with respect to its accuracy, timeliness, or completeness. Authors may own the crypto currency they discuss. The information and content are subject to change without notice. Visionary Financial and its affiliates do not provide investment, tax, legal or accounting advice.
This material has been prepared for informational purposes only and is the opinion of the author, and is not intended to provide, and should not be relied on for, investment, tax, legal, accounting advice. You should consult your own investment, tax, legal and accounting advisors before engaging in any transaction. All content published by Visionary Financial is not an endorsement whatsoever. Visionary Financial was not compensated to submit this article Please also visit our Privacy policy; disclaimer; and terms and conditions page for further information.