Bitcoin BTC/USD remains under intense pressure this week as attempts to rebuild momentum have faded. Following last week’s sharp crash, investors are largely on the sidelines, keeping the cryptocurrency volatile and unpredictable.
Currently, the BTC/USD pair is trading at 112,500, slightly up from this month’s low of 106,300, but technical signals suggest further downside risk. Jordan Parker, a seasoned broker from ProMorion Group, delivers a detailed analysis of the subject in their latest piece.
Market Context: Bitcoin Faces Geopolitical Pressure
Bitcoin price plunged sharply on Tuesday before partially paring back losses, as geopolitical tensions intensified. The latest trigger came from China, which announced measures targeting an American shipping company, escalating the ongoing US-China trade conflict.
This follows last week’s major developments, when Beijing signaled plans to control rare earth material exports, citing national security concerns, and launched an investigation into Qualcomm, one of the top American semiconductor companies.
Such actions have weighed heavily on global risk assets, including Bitcoin, which often reacts to macroeconomic and geopolitical uncertainties.
Bitcoin stabilized after US officials indicated the possibility of a deal with China, potentially ahead of the anticipated meeting between the US President and China’s President at the APEC Summit in South Korea. However, investor sentiment remains cautious, reflecting the heightened volatility in the BTC/USD pair.
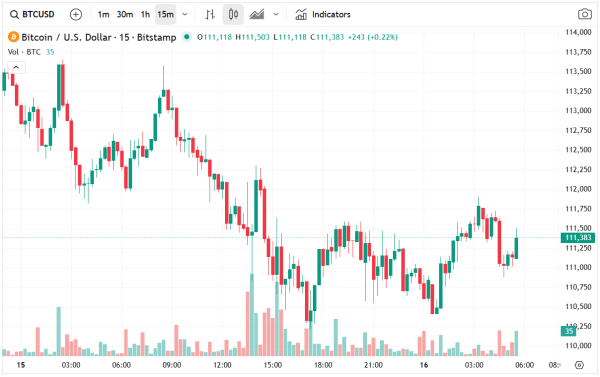
BTC/USD Technical Analysis: Signals Point to Bearish Pressure
From a technical perspective, BTC/USD is showing clear bearish signals. On the daily chart, the pair peaked at over 126,000 earlier this month before dropping to the current 112,520. The volatility is evidenced by the widening spread of the three lines of the Bollinger Bands and a rising Average Directional Index (ADX), indicating a strong trend momentum.
Additionally, the pair has formed a bearish flag pattern, a classic continuation signal, and moved below the 50-day moving average. This combination suggests that a bearish breakout is the most likely scenario in the near term. If the pattern continues, BTC/USD could revisit last week’s low of 107,100, representing a key support level.
Conversely, a move above 115,000, a critical resistance, would invalidate the bearish outlook and indicate potential for upward correction. Traders should therefore monitor these technical levels closely, as they may guide short-term trading decisions.
Macroeconomic Factors: Fed Policy and Market Sentiment
Bitcoin’s price movement is also influenced by monetary policy developments in the United States. Recently, Federal Reserve Chair Jerome Powell delivered a highly dovish statement, signaling a potential end to the quantitative tightening (QT) policy. QT has historically contributed to tighter financial conditions, which can negatively impact risk assets like Bitcoin.
Powell also hinted at a potential interest rate cut in the next Federal Open Market Committee (FOMC) meeting, citing a deteriorating labor market. Traditionally, Bitcoin and other high-risk assets benefit from lower interest rates, as cheaper liquidity encourages investment in alternative assets.
Despite this supportive backdrop, the BTC/USD pair remains under pressure, largely due to weak investor confidence following last week’s sharp decline and the ongoing US-China geopolitical tension.
Market Flows: ETF Outflows Signal Caution
Adding to the bearish narrative, spot Bitcoin ETFs have experienced a net outflow of over $300 million this week. Large ETF outflows often indicate risk aversion among institutional investors and may act as an early signal of further price weakness.
With both technical indicators and market flows pointing to caution, traders should exercise prudence in short-term positions. The combination of geopolitical risk, macro uncertainty, and technically bearish patterns increases the likelihood of further downside in BTC/USD.
Key Levels to Watch
Traders following BTC/USD should focus on several critical levels. Support is at 107,100, representing last week’s low and a key bearish target. Resistance sits at 115,000, which would invalidate the bearish outlook if breached.
The 50-day moving average is currently acting as resistance, while volatility indicators, including widening Bollinger Bands and a rising ADX, signal strong trend momentum. Monitoring these levels is crucial for risk management and trade planning, especially given the current volatility and potential for a bearish breakout.
Conclusion
In summary, BTC/USD remains vulnerable to further downside due to a combination of technical, macroeconomic, and geopolitical factors. The bearish flag pattern, 50-day moving average resistance, and widening Bollinger Bands point to the possibility of another price decline, with 107,100 acting as the next significant support level.
Investors should remain cautious as Bitcoin navigates geopolitical tensions, Fed policy signals, and continued ETF outflows, all of which contribute to a fragile market environment. A break above 115,000 could shift sentiment, but until then, the BTC/USD pair appears poised for a potential crash, making it essential for traders to closely monitor key technical and macro indicators.