The AUD/JPY pair has shown a continuation of its bearish trend as it trades near the 90.00 zone, slipping further during the lead-up to the Asian session. Bearish momentum remains strong as technical indicators suggest that the pair is struggling to hold its ground in the face of downward pressure from key moving averages and momentum oscillators.
This article by the team at NordaLueur examines the current price action, key levels of support and resistance, and the technical indicators shaping the near-term outlook for AUD/JPY.
Price Action and Market Sentiment
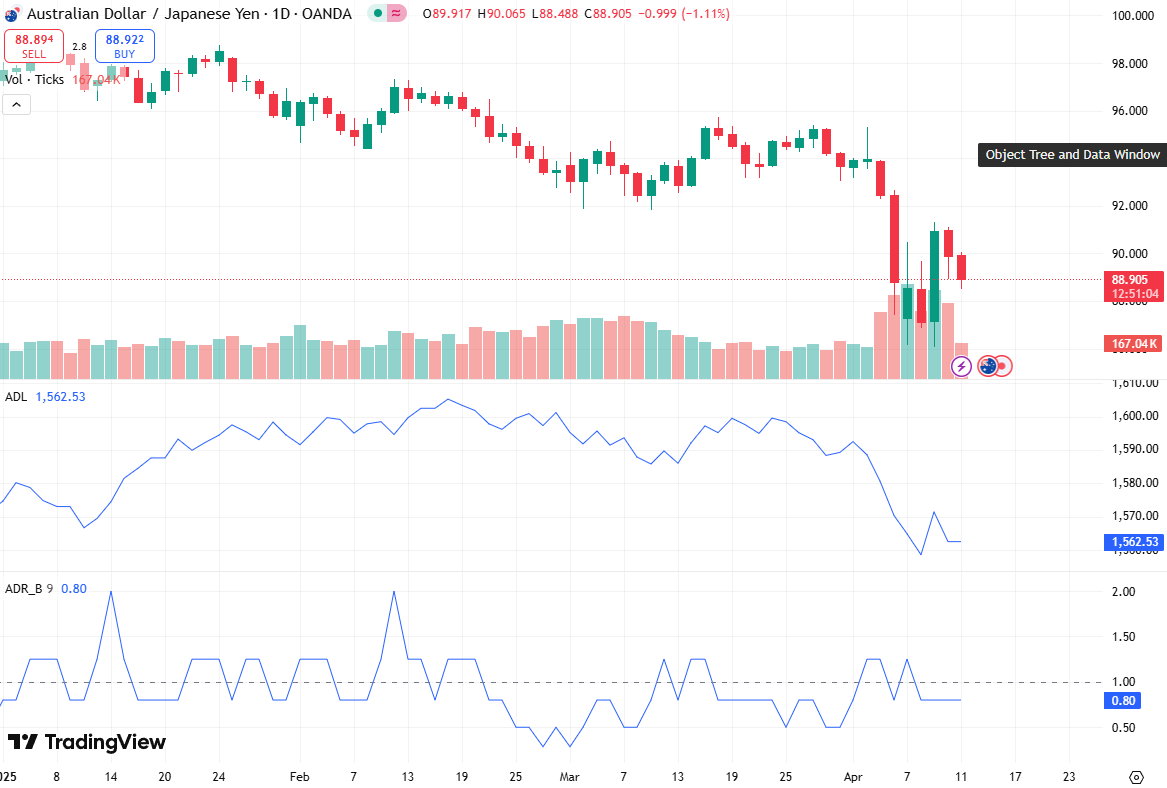
The AUD/JPY pair has extended its downside move, retreating toward the psychologically significant 90.00 area. Sellers have remained in control as price action unfolds within a well-defined range between 88.914 and 91.110. This range continues to shape the short-term market dynamics, with the pair encountering consistent resistance above 91.00 and finding support in the low 88.00s.
The current price action highlights the persistence of bearish sentiment in the market. With traders focused on broader economic factors, including risk sentiment in the Asian session, there is an ongoing push for the Australian dollar (AUD) to underperform against the Japanese yen (JPY), reflecting concerns about global growth and the shifting interest rate differentials between the Reserve Bank of Australia (RBA) and the Bank of Japan (BoJ).
Technical Indicators and Bearish Momentum
A deep dive into the technical landscape reveals that the bearish momentum remains intact, with several indicators reinforcing the downward trend.
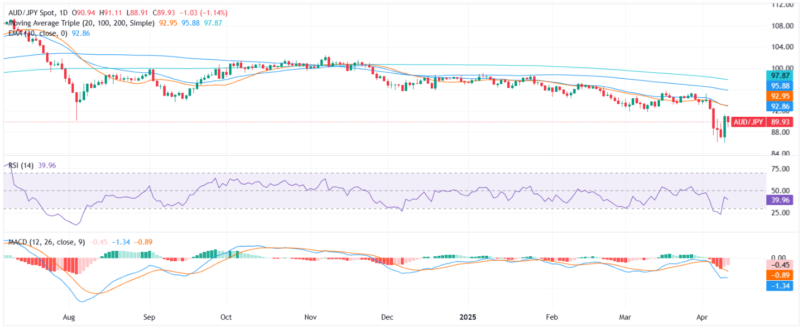
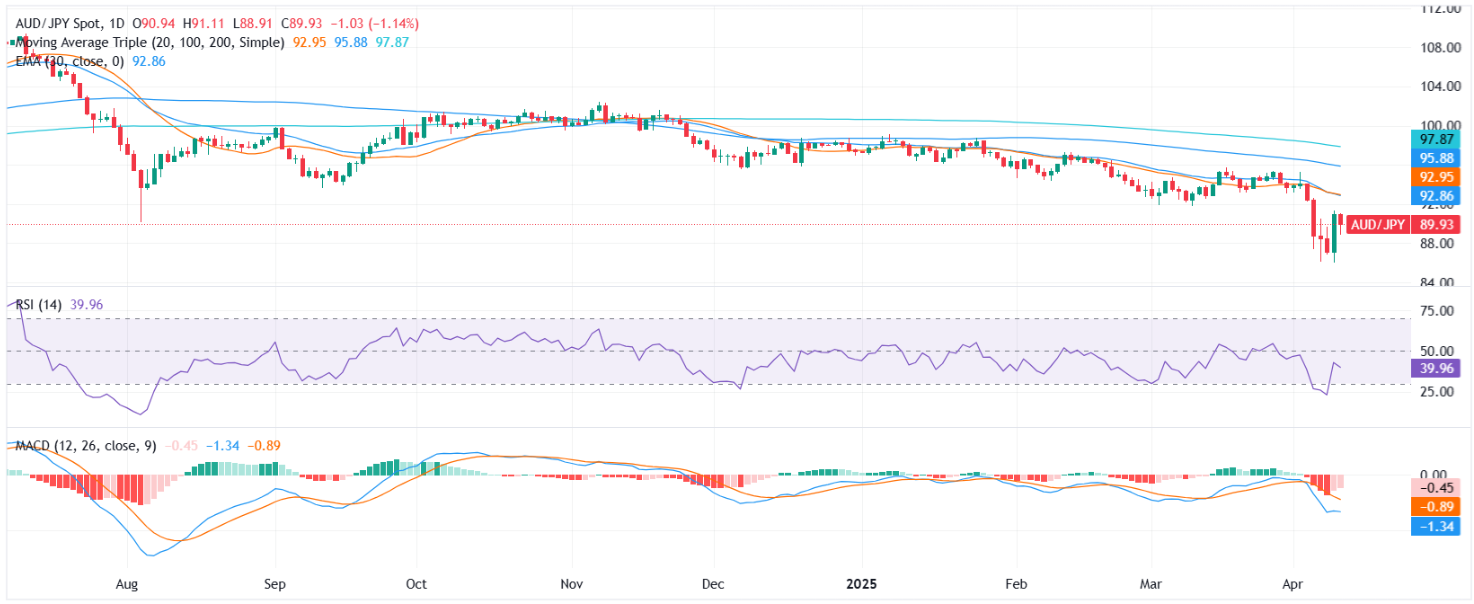
Relative Strength Index (RSI): The RSI currently prints at 40.228, indicating neutral momentum. While this suggests that the pair is not in oversold territory yet, the RSI’s position below the key 50.0 level signals a bearish bias. Traders may interpret this as a lack of significant buying interest, further fueling the downward trend.
Moving Average Convergence Divergence (MACD): The MACD has issued a clear sell signal, adding weight to the bearish outlook. The MACD line remains below the signal line, and the histogram has stayed negative, reinforcing the bearish bias. This suggests that the selling pressure is likely to persist unless there is a major shift in market sentiment.
Momentum Indicators: The 10-period Momentum indicator at -5.120 continues to display a bearish bias, reinforcing the overall downside pressure. However, the Awesome Oscillator remains neutral at -4.170, signaling that while there is downward momentum, it may not be as strong or persistent as suggested by other indicators.
Key Support and Resistance Levels
As the pair hovers near the 90.00 zone, traders are closely watching key support and resistance levels that could define the next move in AUD/JPY.
Support Levels: The primary support level for AUD/JPY is located around the 88.00s, with the pair previously finding a floor in this zone. A sustained break below this support could trigger further downside, with the next potential support area around 87.50 or even lower.
Resistance Levels: On the upside, the 91.00 area remains a key resistance zone, as the pair has repeatedly struggled to break above this level during the recent downtrend. A failure to breach this resistance zone suggests that the selling pressure will continue. Further resistance exists near the 92.00 zone, with the 20-day simple moving average (SMA) at 92.968 serving as a potential hurdle for any short-term rallies.
Moving Averages and Longer-Term Outlook
The longer-term bearish structure of AUD/JPY is further confirmed by the positioning of various moving averages. These moving averages are acting as dynamic resistance points, adding downward pressure to the pair:
The 20-day SMA at 92.968, which has been a significant point of resistance in the recent past, continues to cap any upside potential.
The 100-day SMA at 95.969 and the 200-day SMA at 97.994 are both pointing downward, further emphasizing the bearish trend and suggesting that the pair may face significant resistance in these areas should a rebound materialize.
These longer-term moving averages provide a clear indication of the prevailing downtrend, suggesting that the bearish outlook could persist unless a fundamental shift occurs in market conditions.
Short-Term Indicators
In the short term, the 10-day exponential moving average (EMA) at 90.990 and the 10-day SMA at 91.380 are both signaling sell, further reinforcing the bearish momentum.
As these shorter-term indicators align with the broader technical picture, traders are likely to remain cautious of potential price reversals unless there is a significant break above key resistance levels.
Conclusion
In summary, the AUD/JPY pair continues to face substantial bearish pressure as it trades near the 90.00 zone ahead of the Asia session. Technical indicators point to continued downside momentum, with sell signals from the MACD, momentum oscillators, and moving averages reinforcing the negative outlook. Support in the 88.00s remains crucial for the bears, while resistance around the 91.00 zone continues to cap any potential rallies.
![]()
COMTEX_465096898/2922/2025-05-01T02:21:07
This press release was originally published on this site