We take a look at the XRP price for the week of May 31, 2021. Aside from fundamentals, we rely heavily on technical analysis to assess overall sentiment. This is achieved by identifying key support and resistance levels that traders and investors will be watching in the short term. As Visionary Financial outlined in the previous XRP analysis ( April 25th, 2021 ), $0.84 levels were re-tested after rejecting important support. We now see an environment where XRP is changing sentiment and bulls are reaccumulating.
XRP Price
At the time of this report, XRP is currently trading at $1.0136. The 6th largest digital asset by market cap has surged ~ 26% over the last week. This has outperformed Bitcoin, which has only seen ~ 5.6% growth over the last 7 days. Despite XRP’s recent rally, the cryptocurrency has still fallen ~36% over the last month. In recent XRP analysis sourced by Visionary Financial, we outlined a scenario where XRP would sell-off and re-test $0.84 levels before changing sentiment. This analysis played out quite well after rejecting $1.05 support.
Based on the current price action, we believe that selling is exhausted and buyers are re-deploying risk capital at these levels.
XRP Technical Analysis
After XRP’s recent sell-off to $0.85 support, we have seen strong buying at these levels. We now enter a new cycle where bulls seem to be re-deploying risk capital at these levels. At the time of this report, we are watching $1.07 resistance. We believe that XRP will experience another leg up if $1.07 resistance can be slashed. Let’s take a look at the updated chart below.
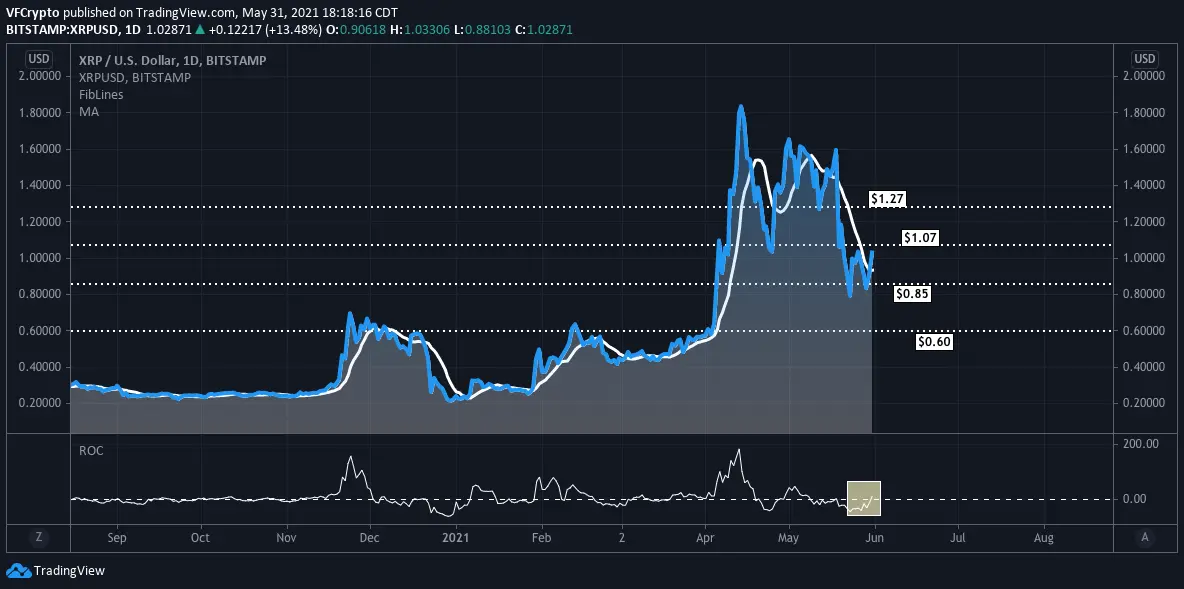
As originally believed, XRP is forming positive momentum after selling off to $0.85 support levels. If XRP can break through $1.07 resistance in the short term, we believe that the digital asset will re-test $1.27 levels in the short term. On the flip side, $0.85 is still the key support right now. We will not remain bullish unless $0.85 support is rejected.
We are watching ROC quite heavily here. As discussed many times before, we believe that ROC indicators are one of the best ways to measure investor sentiment. When ROC hovers above 0.00 levels, this denotes bullish momentum. At the time of this report, we are seeing XRP flip sentiment by beginning to inch over 0.00 levels. This has historically been a great indicator for XRP. If you look at previous price action, strong price rallies have occurred after ROC cracks above 0.00. At the moment, XRP seems to be coming out of oversold territories quite rapidly. Watch for a strong push-up if $1.07 is accepted this week.
Notice: Information contained herein is not and should not be construed as an offer, solicitation, or recommendation to buy or sell securities. The information has been obtained from sources we believe to be reliable; however, no guarantee is made or implied with respect to its accuracy, timeliness, or completeness. Authors may own the cryptocurrency they discuss. The information and content are subject to change without notice. Visionary Financial and its affiliates do not provide investment, tax, legal, or accounting advice.
This material has been prepared for informational purposes only and is the opinion of the author, and is not intended to provide, and should not be relied on for, investment, tax, legal, accounting advice. You should consult your own investment, tax, legal, and accounting advisors before engaging in any transaction. All content published by Visionary Financial is not an endorsement whatsoever. Visionary Financial was not compensated to submit this article Please also visit our Privacy policy; disclaimer; and terms and conditions page for further information.